On Wednesday, FinTwit personality @MrZackMorris maintained his bullish thesis on Camber Energy, Inc CEI and raised his personal price target to $10. The stock was trading down over 20% at one point on Friday but could be consolidating to cool down the relative strength index (RSI) and garner the strength to move higher.
The crude oil and natural gas producer has a relatively small float with just 104.19 million shares available for trading and high short interest with 24.49 million (meaning about 23%) held short.
See Also: 5 Stocks To Watch For October 1, 2021
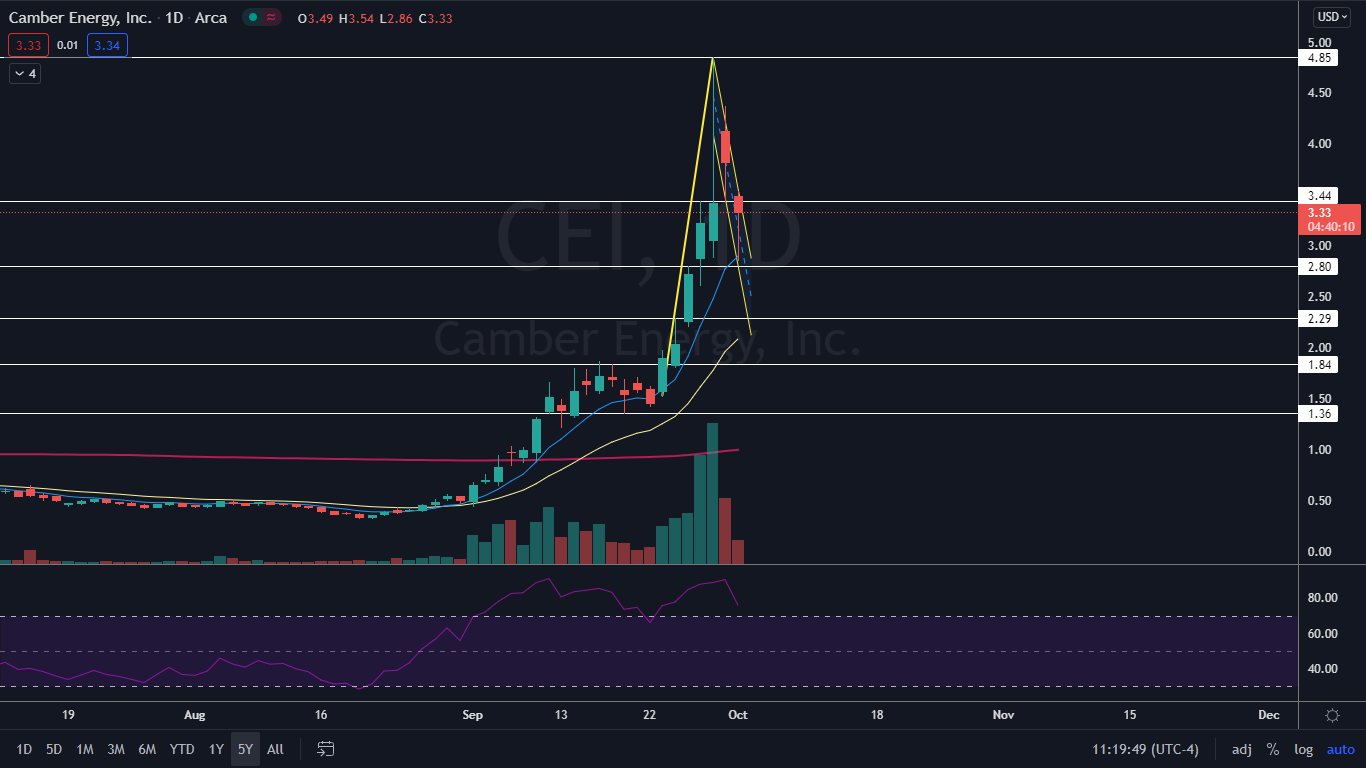
The Camber Energy Chart: On Sept. 29, Camber Energy made a new 52-week high of $4.85 but ran into a group of profit takers and on Oct. 1 was trading down about 36% from the level. If the stock closes near its low of the day it will print a bearish Marubozu candlestick, which could indicate lower prices are in the cards for Monday.
The drop in Camber Energy’s price is taking place between two parallel lines and paired with the parabolic rise between Sept. 23 and Sept. 29, the stock could be settling into a bull flag pattern on the daily chart. The bull flag pattern will stay intact as long as Camber Energy, continues trading within the channel, doesn’t lose support of the eight-day exponential moving average (EMA) and doesn’t drop further than 50% the length of the pole.
Further consolidation within the flag is needed to drop Camber Energy’s RSI down below the 70% level. On Wednesday the RSI was measuring slightly above the level but lower than the 90% mark the stock reached on Thursday. When a stock’s RSI reaches or exceeds 70% it becomes overbought, which is a sell signal for technical traders.
Camber Energy is trading above the eight-day and 21-day EMAs, with the eight-day EMA trending above the 21-day, both of which are bullish indicators. The stock is also trading just under 200% above the 200-day simple moving average, which indicates overall sentiment in Camber Energy is bullish.
- Bulls want to see continued consolidation within the flag and then for big bullish volume to come in and break Camber Energy up from the flag pattern. The stock has resistance above at $3.44 and above the level there is not much resistance until the 52-week high mark.
- Bears want to see big bearish volume come in and drop Camber Energy’s stock down below the eight-day EMA to negate the bull flag pattern. The stock has support below at $2.80 and $2.29.
© 2025 Benzinga.com. Benzinga does not provide investment advice. All rights reserved.
Trade confidently with insights and alerts from analyst ratings, free reports and breaking news that affects the stocks you care about.

