


Alibaba Group Holdings Ltd BABA rallied in Hong Kong on Monday and when the U.S. markets opened the stock gapped up over 4% higher before running into a group of profit takers. There is increased investor optimism the worst of China’s regulatory crackdown may be over and beaten down China-based tech stocks could begin to recover.
Beginning at 9:30 a.m. options traders began to hammer dozens of bullish Alibaba call contracts. At 9:42 a.m., a trader purchased 964 contracts with a $150 strike and an expiry for this Friday. The trader paid $17.82 per contract and the order cost a total of over $1.71 million.
Later in the morning, when Alibaba failed to pop over a resistance level at $170 a few bearish put contracts were placed. One trader paid a total of over $1.62 million for 750 contracts costing $21.70 per piece. The trader chose a strike price of March 18, 2022, and a $170 expiry.
The Alibaba Chart: Alibaba created a bullish triple bottom pattern $139 level on Oct. 4, 5 and 6. The pattern was recognized and the stock reversed course and soared up over 20% higher over the following three trading days before slamming into resistance Monday morning.
The move higher allowed Alibaba to buck its months-long downtrend and put in a higher high above the Sept. 28 lower high of $153.88. The stock will eventually need to put in a lower high on the daily chart to give bulls confidence the upward move is a trend change and not an oversold bounce.
A concern for both bullish and bearish traders is the number of gaps on Alibaba’s chart. Gaps on charts are filled about 90% of the time, so it's likely Alibaba will fill both the lower and higher gaps in the future.
Alibaba’s closest lower gap falls between $162.78 and $165.62 with a second down between $144.89 and $150.75. The stock has a gap above between $177.89 and $181.51 and another up between the $193.11 and $194.73 range.
Alibaba is trading above the eight-day and 21-day exponential moving averages (EMAs), and if the stock continues to trend higher the eight-day EMA will cross above the 21-day, which would be bullish for the short-term. The stock is trading well below the 200-day simple moving average, however, which indicates overall sentiment is bearish.
- Bulls want to see Alibaba print a lower high, and it would be ideal if the stock filled the gap directly below. Big bullish volume could then drive Alibaba up over the higher resistance level. If the stock can regain the level as support, it has room to trade up toward the $179.15 level which would put it into the closest higher gap.
- Bears want to see Alibaba continue to reject the $170 zone and for big bearish volume to come in and drop the stock down below another support level at $155, which would cause the stock to lose support of the eight-day and 21-day EMAs. Below the level there is support at $147.95.
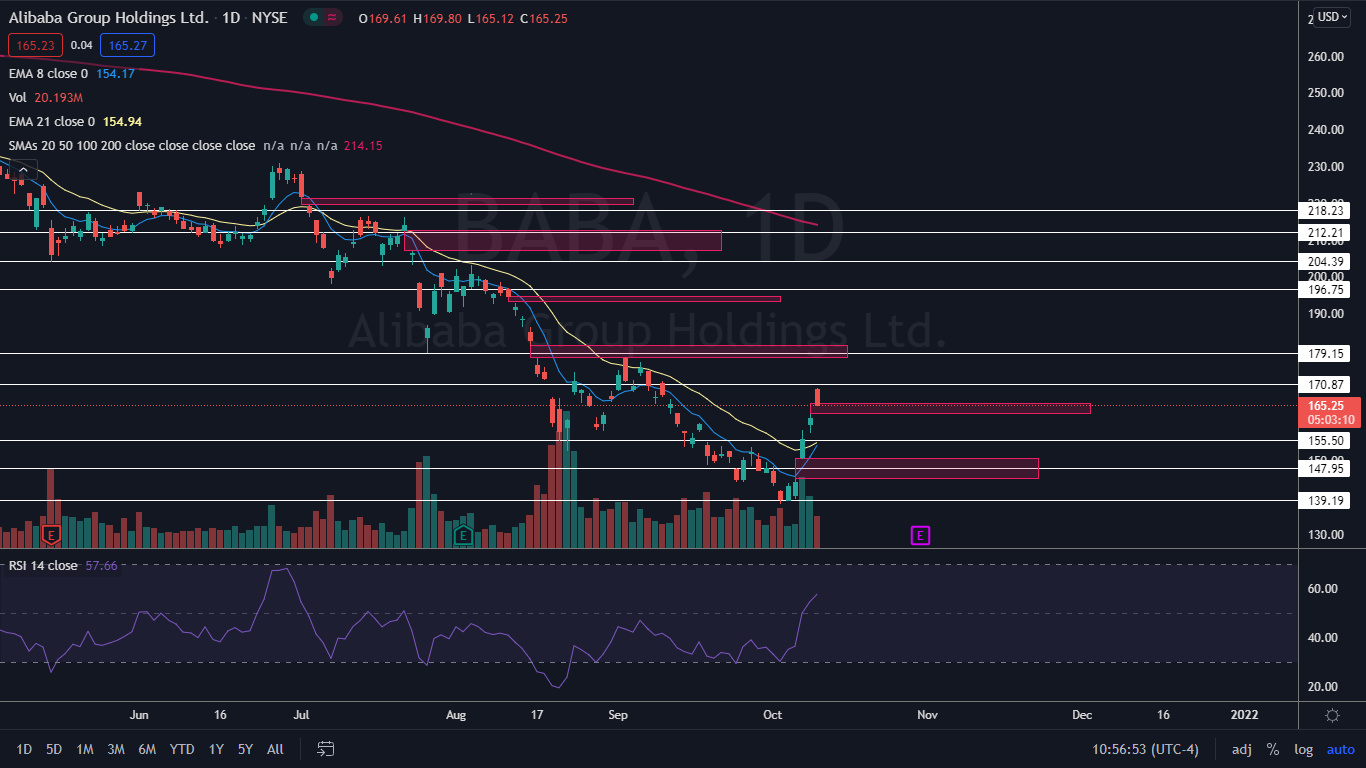
Photo: Courtesy Alibaba
Edge Rankings
Price Trend
© 2025 Benzinga.com. Benzinga does not provide investment advice. All rights reserved.
Trade confidently with insights and alerts from analyst ratings, free reports and breaking news that affects the stocks you care about.

