Intel Corporation INTC was trading down nearly 12% late in Friday's session. The American multinational technology company missed on revenues for the third quarter and subsequently received a number of analyst downgrades.
See Also: How to Read Candlestick Charts for Beginners
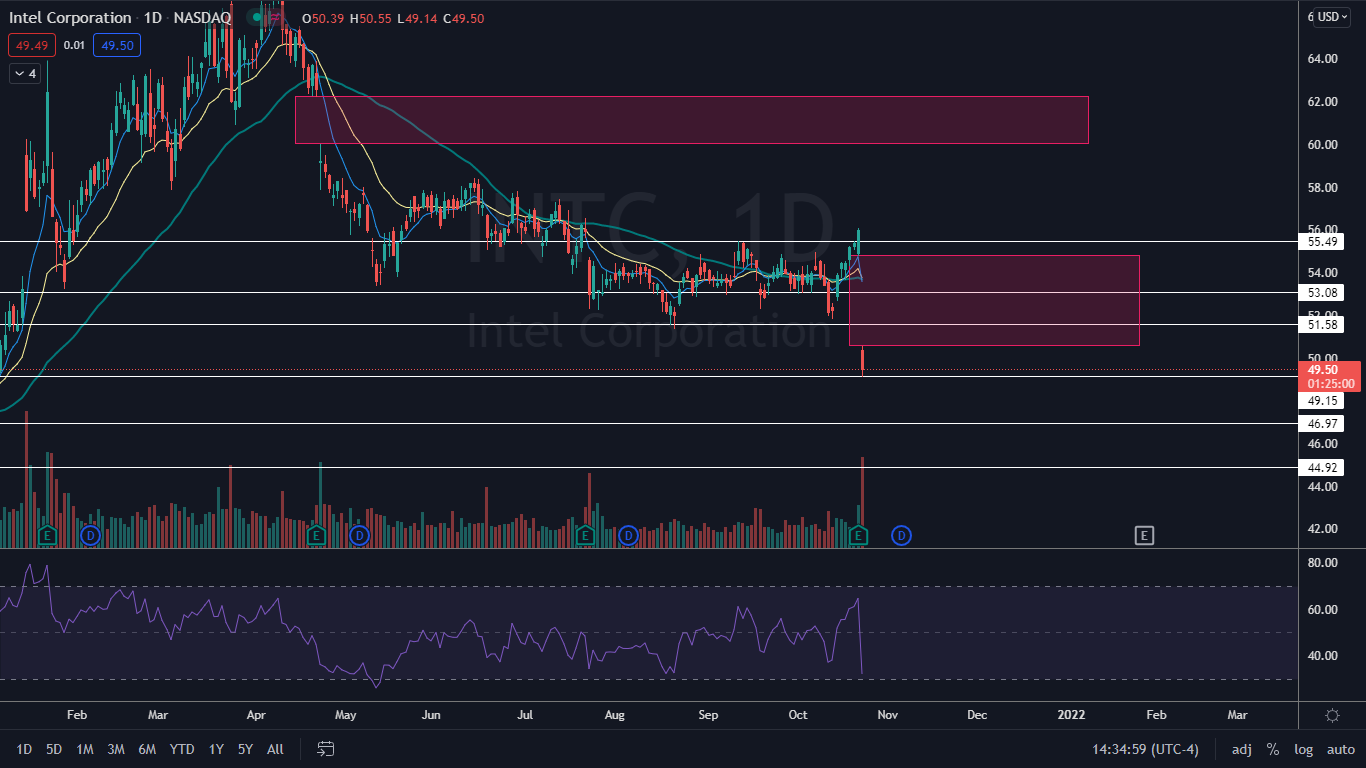
The Intel Chart: Intel fell through two support levels at $53.08 and $51.58 but bounced up from the $49.15 mark when the stock tested the level as support. Intel has not traded this low since Jan. 11 and could fall even lower if Friday’s candlestick is recognized.
Intel was working to print a bearish kicker candlestick pattern on the daily chart, which indicates that even if the stock holds above the support level on Friday, it could fall through it during Monday’s trading session. The bearish earnings reaction also led to higher-than-average volume, with 80.58 million shares exchanging hands by midafternoon, compared to the 10-day average of 24.82 million, which indicates a high level of investor interest in exiting their positions.
There are two gaps above on Intel’s chart, with the first gap sitting between $50.55 and $54.83 and the second between $60 and $62.28. Since gaps on charts fill, it is likely Intel will trade up into both ranges in the future, although it is unlikely to occur soon.
Intel should get a bounce in the short-term, however, because the relative strength index (RSI) is measuring in at about 31%. When a stock’s RSI reaches or exceeds 30%, it can be a buy signal for technical traders because it indicates oversold conditions.
Intel is trading below the eight-day and 21-day exponential moving averages (EMAs), with the eight-day EMA crossing below the 21-day, both of which are bearish indicators.
The stock also lost support of the 50-day simple moving average, which indicates longer-term sentiment has turned bearish.
- Bulls want to see Intel hold above $49.15 and for sideways consolidation to begin on low volume. If big bullish volume then entered the stock, it could rise up and begin to fill the closest gap. There is resistance above at $51.58 and $53.08.
- Bears want to see Intel fall through the closest support level and for continued big bearish volume to drop the stock down toward the $46.97 level. If Intel is unable to hold the level as support, it could fall further toward $44.92.
 Want direct analysis? Find me in the BZ Pro lounge! Click here for a free trial.
© 2024 Benzinga.com. Benzinga does not provide investment advice. All rights reserved.
Comments
Trade confidently with insights and alerts from analyst ratings, free reports and breaking news that affects the stocks you care about.