Netlist Inc. NLST shares are trading higher Monday after the company announced that the Federal District Court for the Central District of California granted summary judgments in favor of Netlist and against Samsung. The summary judgments were for material breach of various obligations under the Joint Development and License Agreement.
Netlist was up 19.62% at $7.50 at last check Monday afternoon.
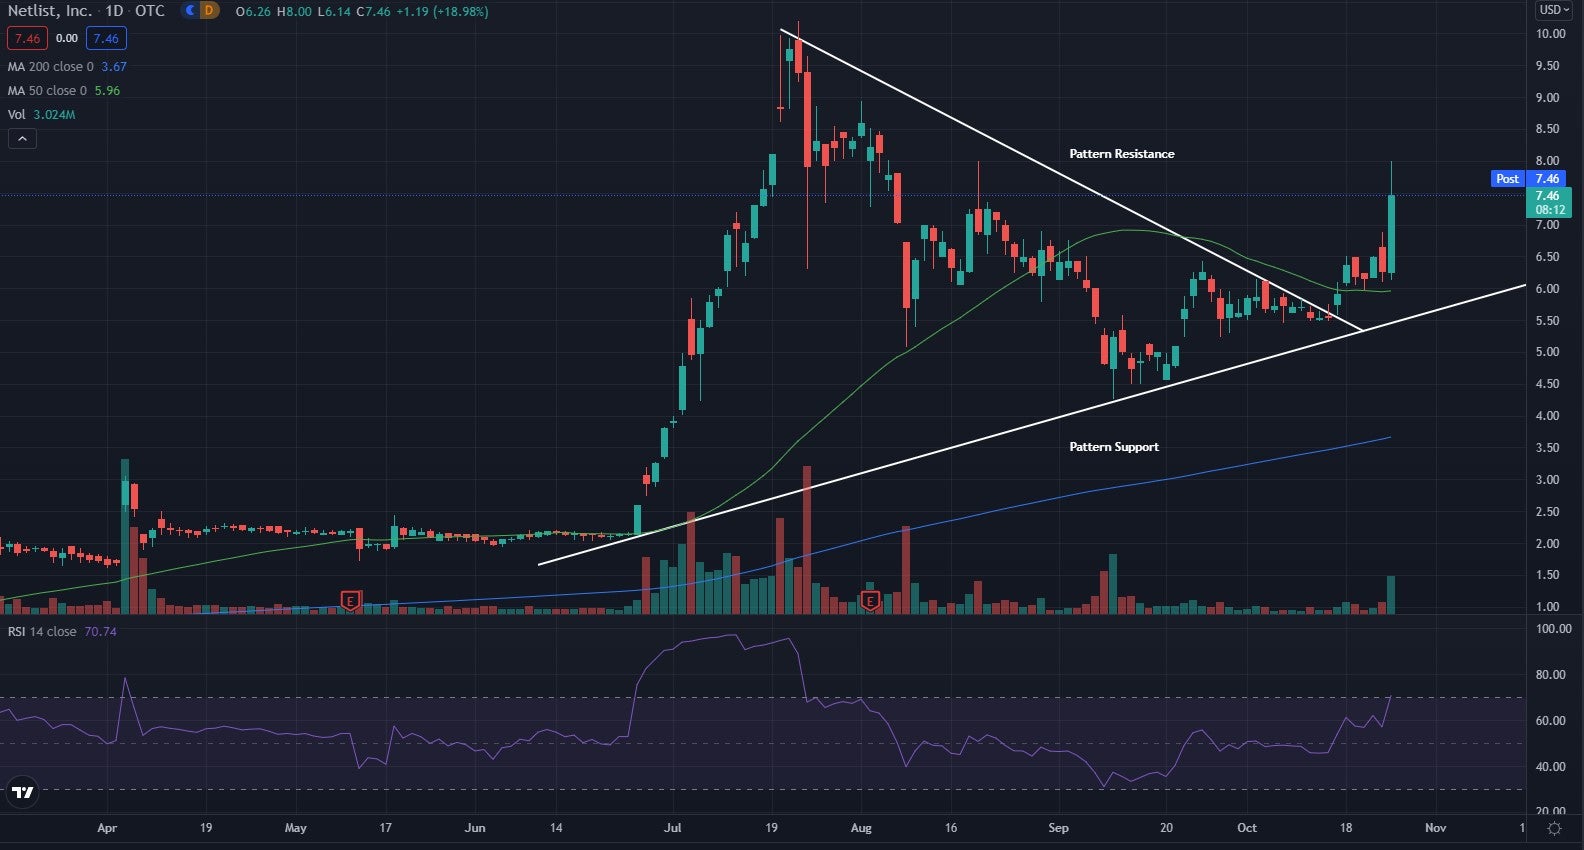
Netlist Daily Chart Analysis
- Shares look to have broken out of what technical traders call a pennant pattern. The stock looks to be possibly holding above the pattern support line and now acting as a higher low trendline.
- The stock was pinched between narrowing highs and lows before the pattern resistance was broken. This break is signaling a breakout and an above-average volume day sent the stock higher Monday.
- The stock trades above both the 50-day moving average (green) and the 200-day moving average (blue), indicating the stock is seeing bullish sentiment.
- Each of these moving averages may hold as a possible area of support in the future.
- The Relative Strength Index (RSI) has been trending higher the past couple of weeks and now sits 68. This shows that more buyers have stepped into the stock in the past few weeks.
What’s Next For Netlist?
Bullish traders are looking to see the stock continue to trade above the pattern support line. This line is showing higher lows where the stock has found support in the past. The support line may continue to hold in the future for a time.
Bearish traders are looking to see the stock fall below the pattern support line. This could hint that the stock is ready to see a strong bearish push sometime in the future.
Image by Pete Linforth from Pixabay
© 2025 Benzinga.com. Benzinga does not provide investment advice. All rights reserved.
Trade confidently with insights and alerts from analyst ratings, free reports and breaking news that affects the stocks you care about.
