FuelCell Energy Inc FCEL shares are trading higher Thursday, possibly after President Joe Biden today discussed his economic framework, which includes a national network of 500,000 electric vehicle charging stations.
FuelCell was up 8.14% at $7.57 at market close Thursday.
FuelCell Daily Chart Analysis
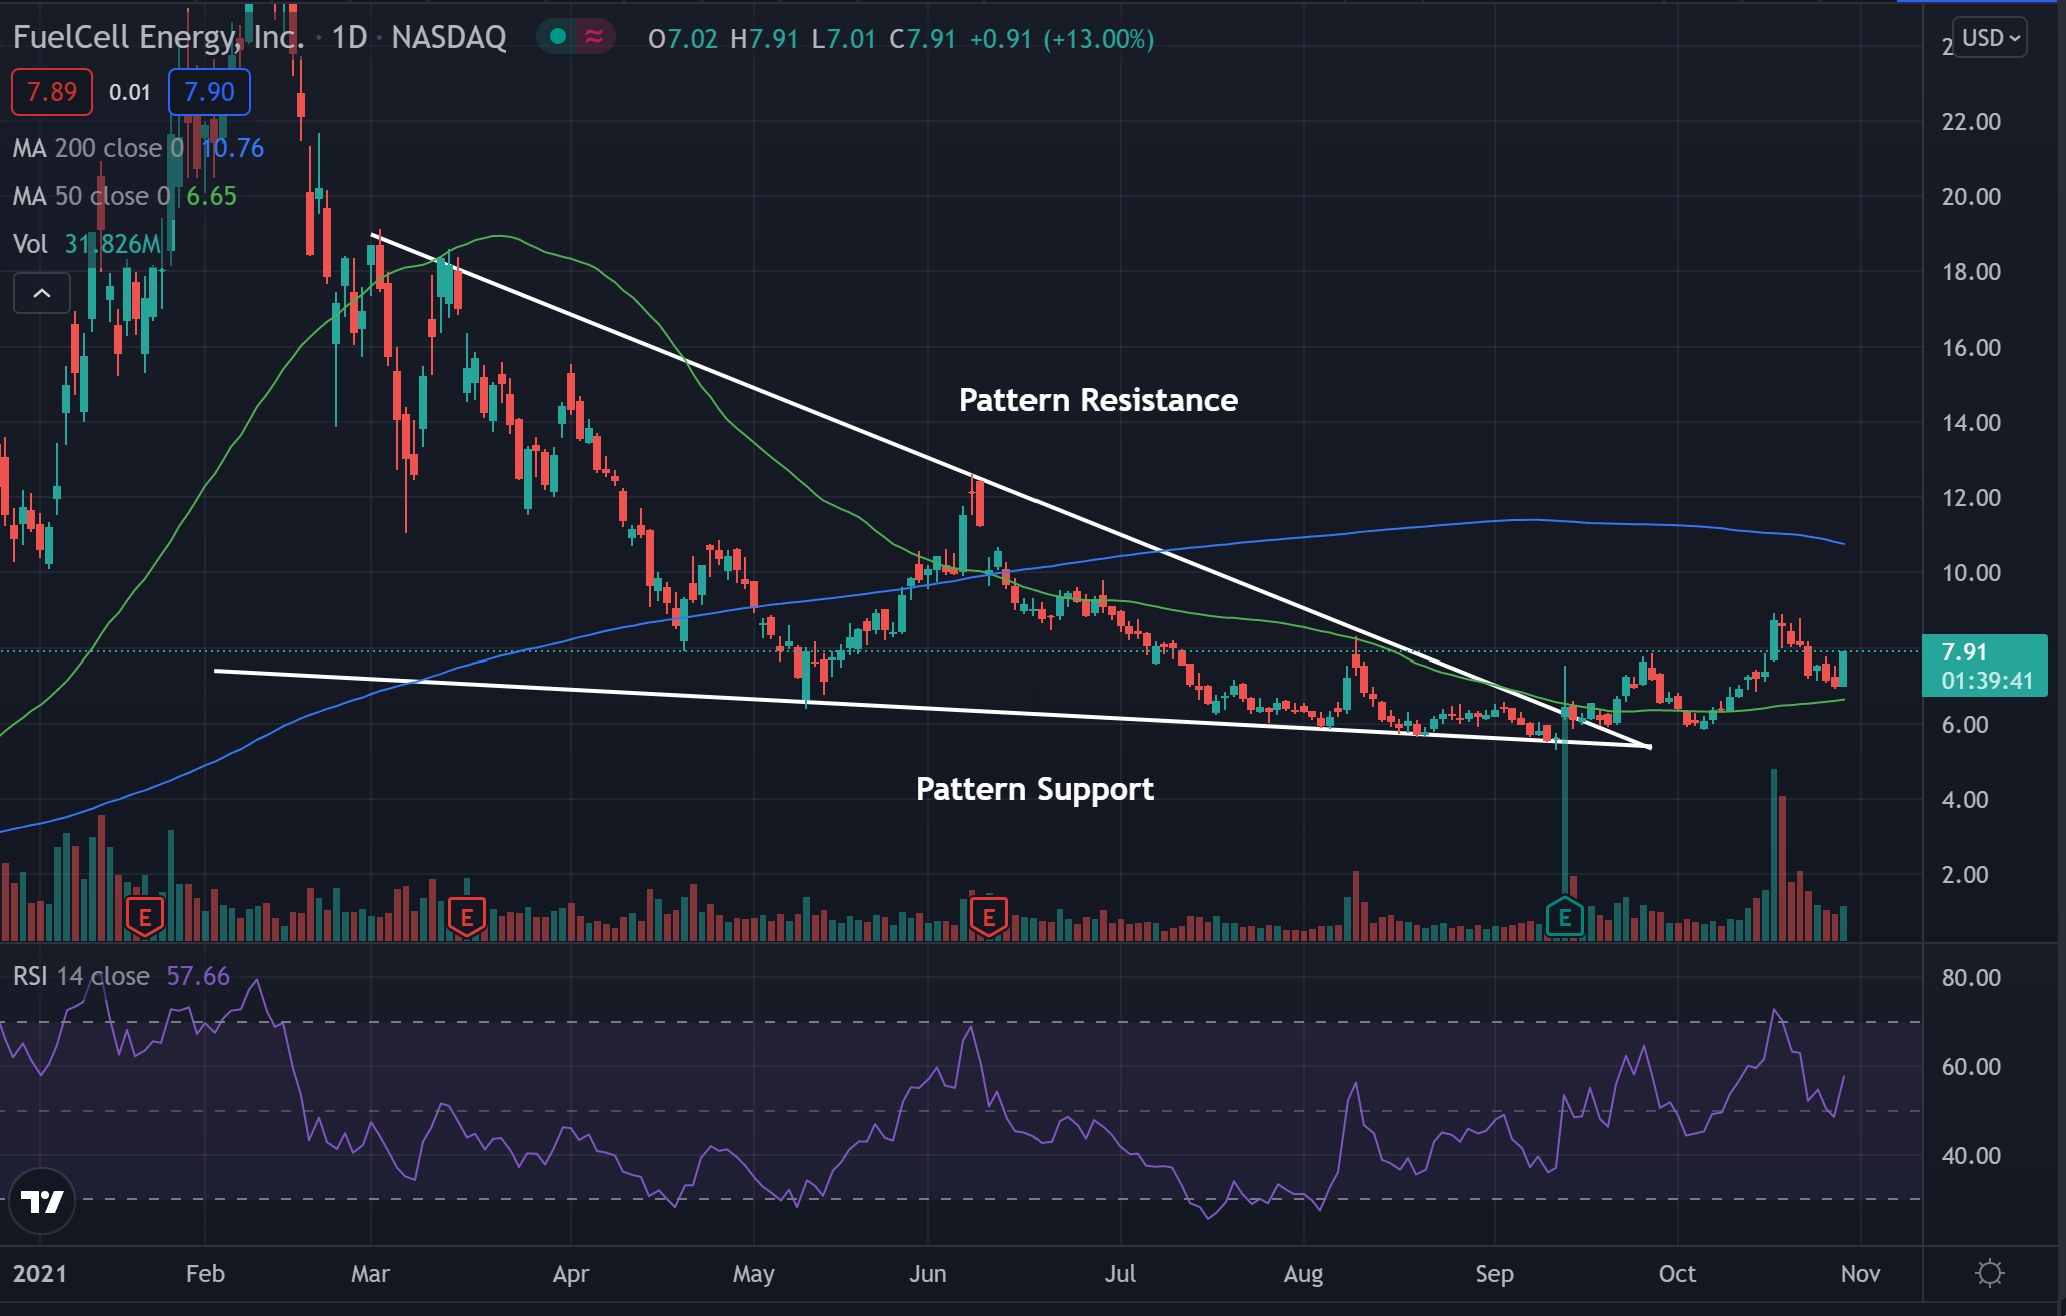
- The stock has broken out of what technical traders call a falling wedge pattern. The break of pattern resistance looks to have started a reversal of the stock.
- The price was being pinched between narrowing highs and lows until it broke above pattern resistance. This break showed the stock broke out of the downtrend it was in. It is a possible sign the stock could see an uptrend soon.
- The stock trades above the 50-day moving average (green) but below the 200-day moving average (blue), indicating the stock is likely facing a period of consolidation.
- The 50-day moving average may hold as an area of support, while the 200-day moving average may act as a place of resistance.
- The Relative Strength Index (RSI) looks to be consolidating sideways and now sits at 57. Although the RSI has been moving sideways the stock still has seen more buying pressure overall.
See Also: Why FuelCell Shares Are Rising

What’s Next For FuelCell?
Bullish traders want to see the stock continue to form higher lows. This would confirm the stock is in an uptrend. Bullish traders would want to see the stock continue to hold above a higher low trendline, if one is able to form.
Bearish traders are hoping to see the stock unable to make higher lows. Bears are looking to see the stock fall below the 50-day moving average, and for the RSI to dip back below 50. Bears are hoping to see lower highs in the stock.
© 2025 Benzinga.com. Benzinga does not provide investment advice. All rights reserved.
Trade confidently with insights and alerts from analyst ratings, free reports and breaking news that affects the stocks you care about.