


Peloton Interactive Inc. PTON shares were trading higher Monday morning, but have since cooled off.
The company is reporting earnings this week alongside some other popular stocks such as Square Inc. SQ AirBnb Inc. ABNB and Etsy Inc. ETSY.
Peloton was down 1.3% at $90.22 at press time.
See Related: Monday's Market Minute: Slow Start to a Busy Week
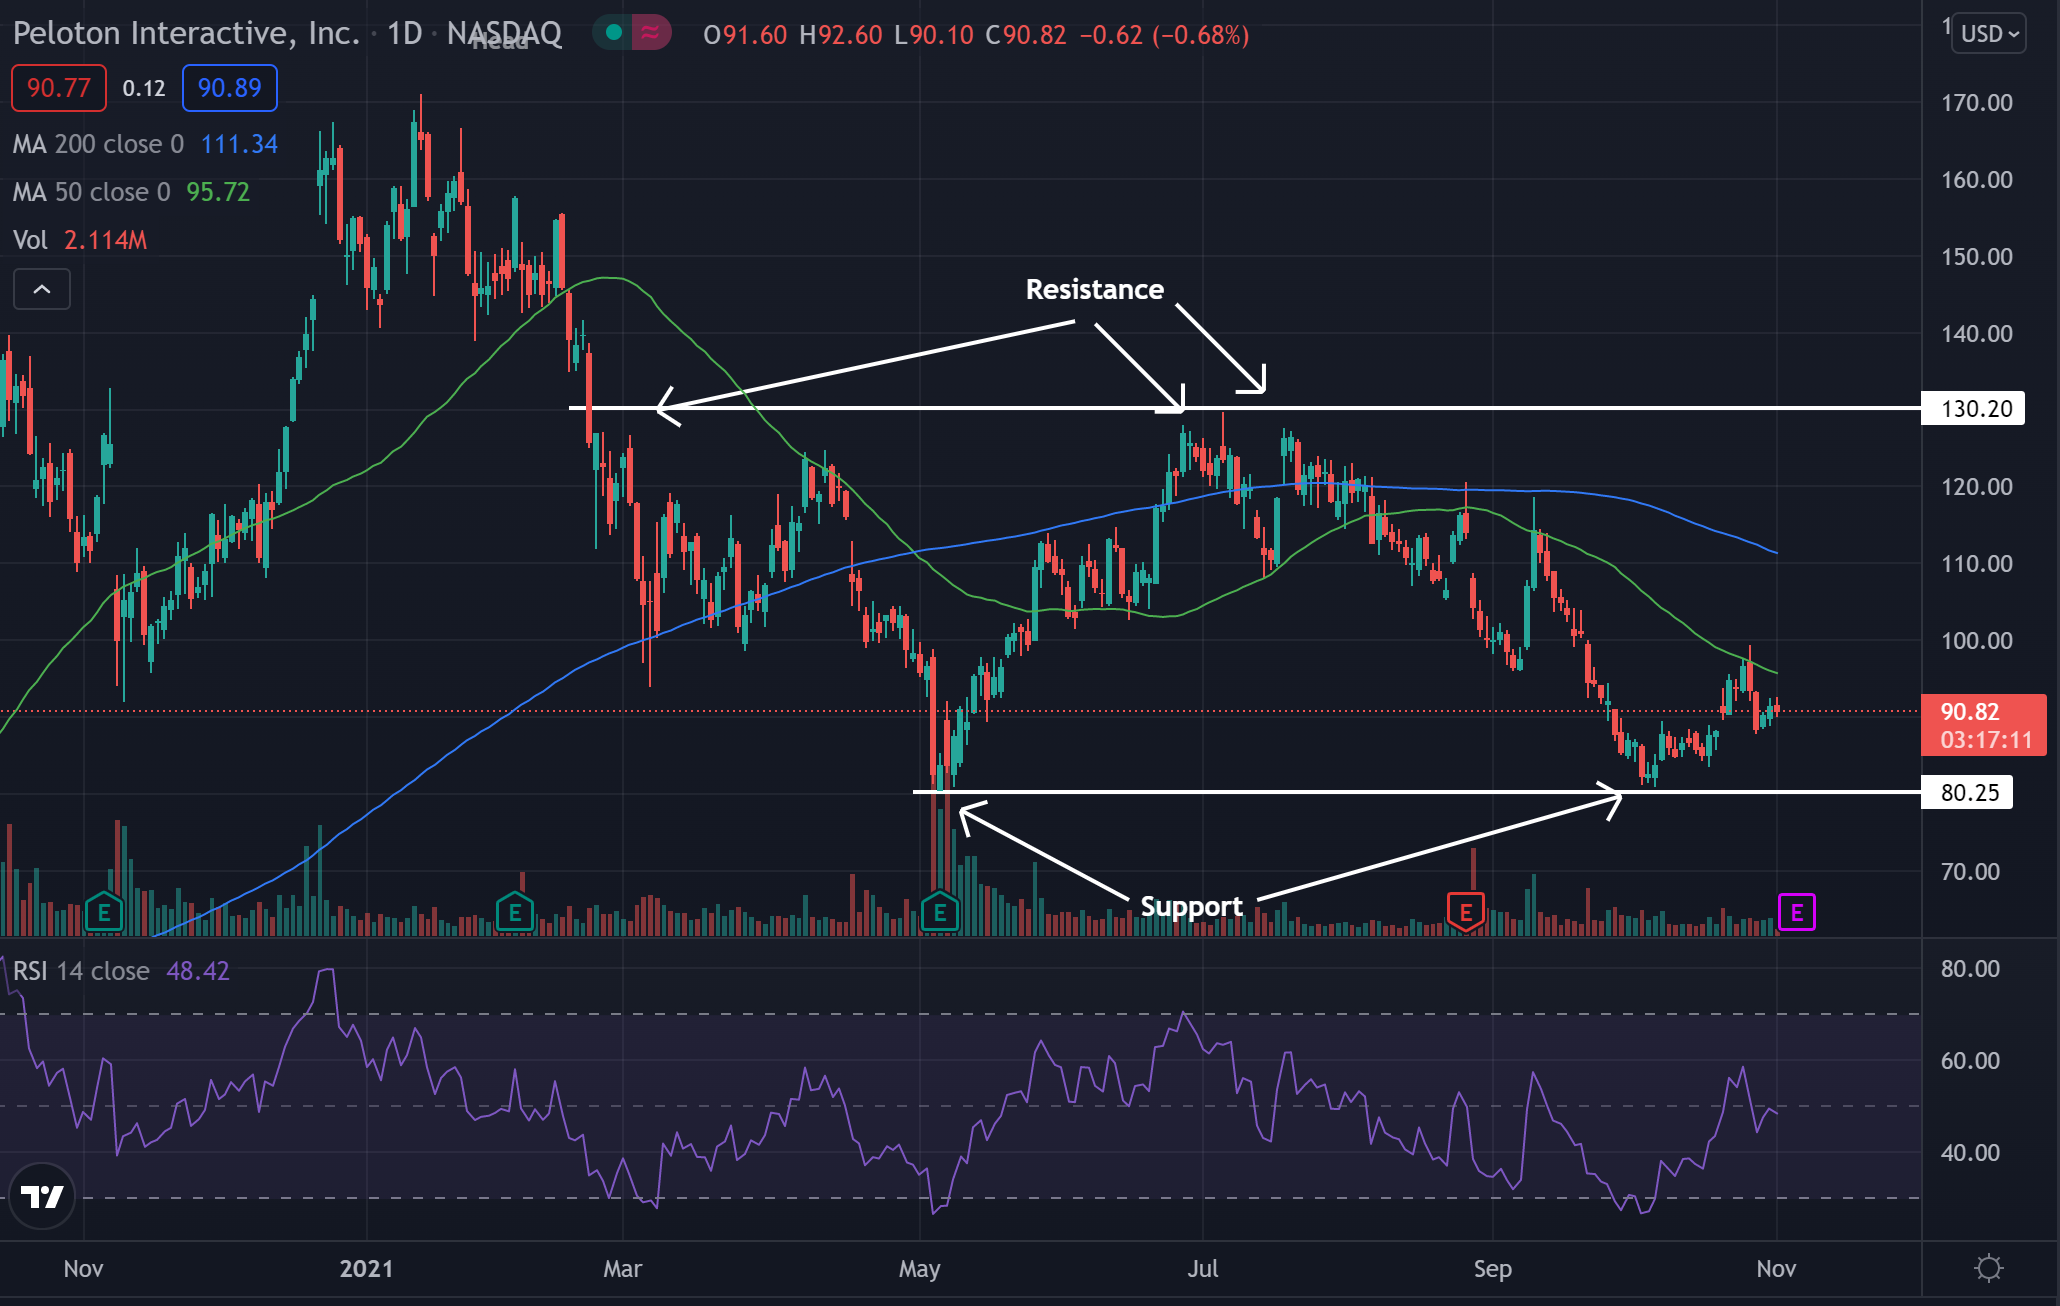
Peloton Daily Chart Analysis
- The stock looks to have bounded off of support in what technical traders call a sideways channel pattern.
- The $130 price level is an area where the stock has struggled to cross above in the past. This area may continue to hold as resistance in the future. The $80 level is somewhere the stock looks to have recently found support and may hold again in the future.
- The stock trades below both the 50-day moving average (green) and the 200-day moving average (blue), indicating the stock is likely facing a period of bearish sentiment.
- Each of these moving averages may hold as a potential area of resistance in the future.
- The Relative Strength Index (RSI) has been moving sideways the past couple weeks and sits at 48. This shows the stock has been in a period of consolidation and buying pressure has been relatively equal to selling pressure.
What’s Next For Peloton?
Bullish traders want to see the stock continue to form higher lows and push toward the $130 resistance level. Bulls would eventually like to see a break above this resistance level for the stock to continue to see bullish moves in the future.
Bearish traders are looking to see the stock start to fade back lower and head toward the support level. Bears are then looking to see a break below this support level and for it to hold below the level, possibly causing further bearish moves in the future.
Edge Rankings
Price Trend
© 2025 Benzinga.com. Benzinga does not provide investment advice. All rights reserved.
Trade confidently with insights and alerts from analyst ratings, free reports and breaking news that affects the stocks you care about.

