Ford Motor Company F shares are trading higher Wednesday after the company reported October auto sales. October sales came in at 175,918 vehicles, a decrease of 4% year over year. The stock was trending on social media sites such as StockTwits.
Ford was up 3.44% at $18.63 at market close Wednesday.
Ford Daily Chart Analysis
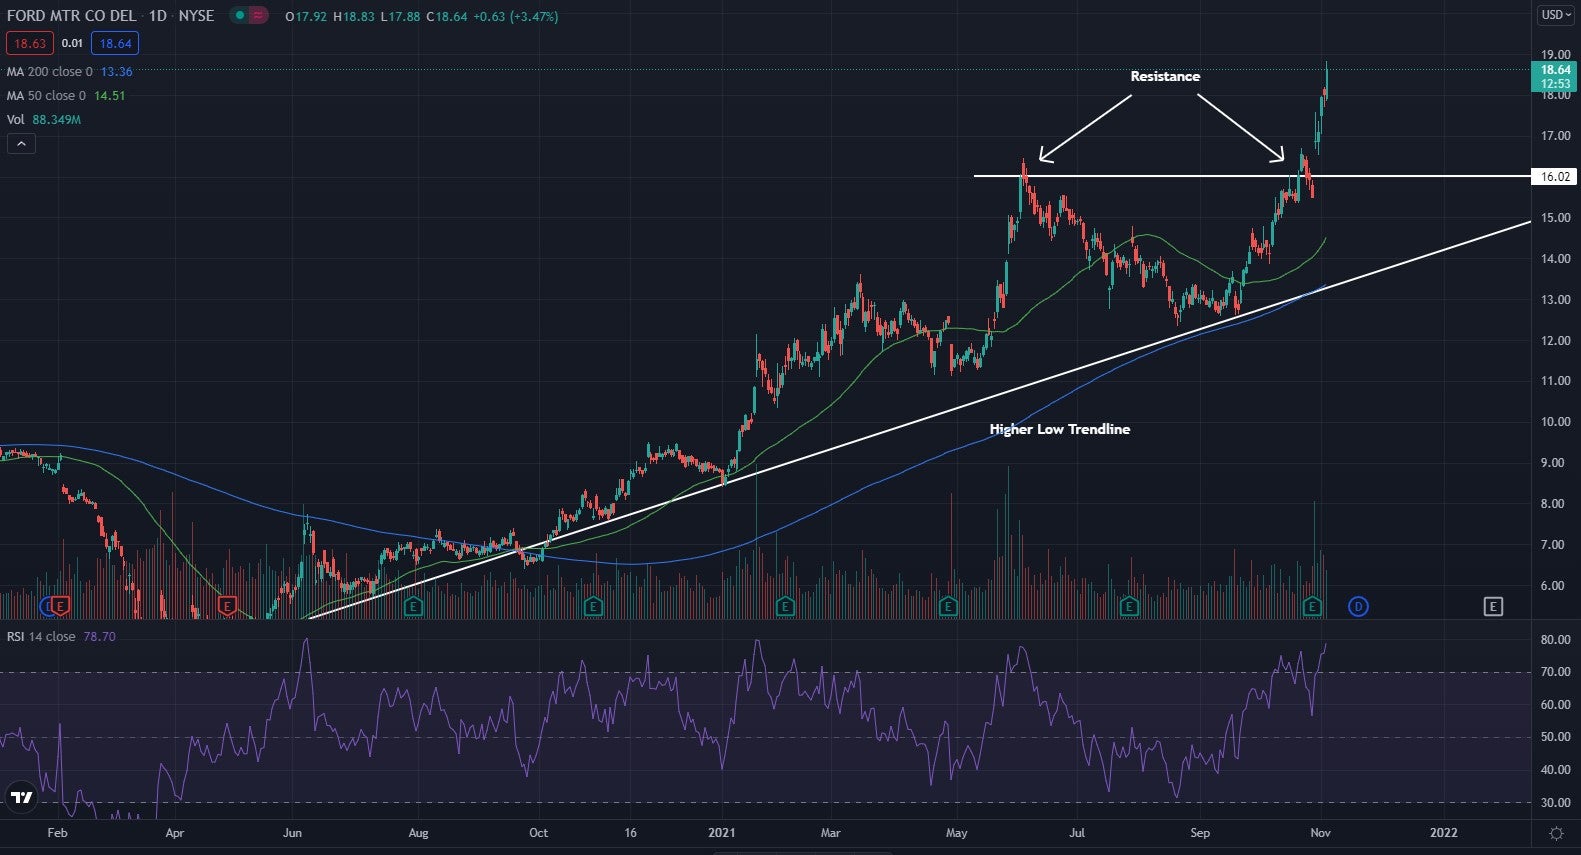
- The stock looks to have recently broken out of what technical traders call an ascending triangle pattern and is flying away from the long-standing higher low trendline.
- The $16 level had held as resistance for a time before the stock was able to break above the level, see a period of consolidation and take off further. The higher low trendline has been an area of support for the stock since the large COVID-19 dip.
- The stock trades above both the 50-day moving average (green) and the 200-day moving average (blue), indicating the stock is likely facing a period of bullish sentiment.
- Each of these moving averages may hold as an area of support in the future.
- The Relative Strength Index (RSI) has been flying higher and now sits at 79. This shows the stock is seeing much more buying pressure than selling pressure. A high RSI could signal that the stock is ready to see a reversal soon, so traders should take caution when deciding to begin a position in the stock.
See Related: Why Ford Shares Are Rising

What’s Next For Ford?
Bullish traders are looking to see the stock continue to trade above the higher low trendline. This trendline has shown traders a healthy and sustainable rate of growth. Bulls are in full control of the stock as it sits now.
Bearish traders are looking to see the stock cool off and then fall below the higher low trendline. A break below the higher low trendline could signal the stock is ready to see a change in trends and possibly start a downward trend. Bears are also looking for the stock to fall below the moving averages for a possible change in sentiment.
Photo by Yogendra Singh on Unsplash
Edge Rankings
Price Trend
© 2025 Benzinga.com. Benzinga does not provide investment advice. All rights reserved.
Trade confidently with insights and alerts from analyst ratings, free reports and breaking news that affects the stocks you care about.