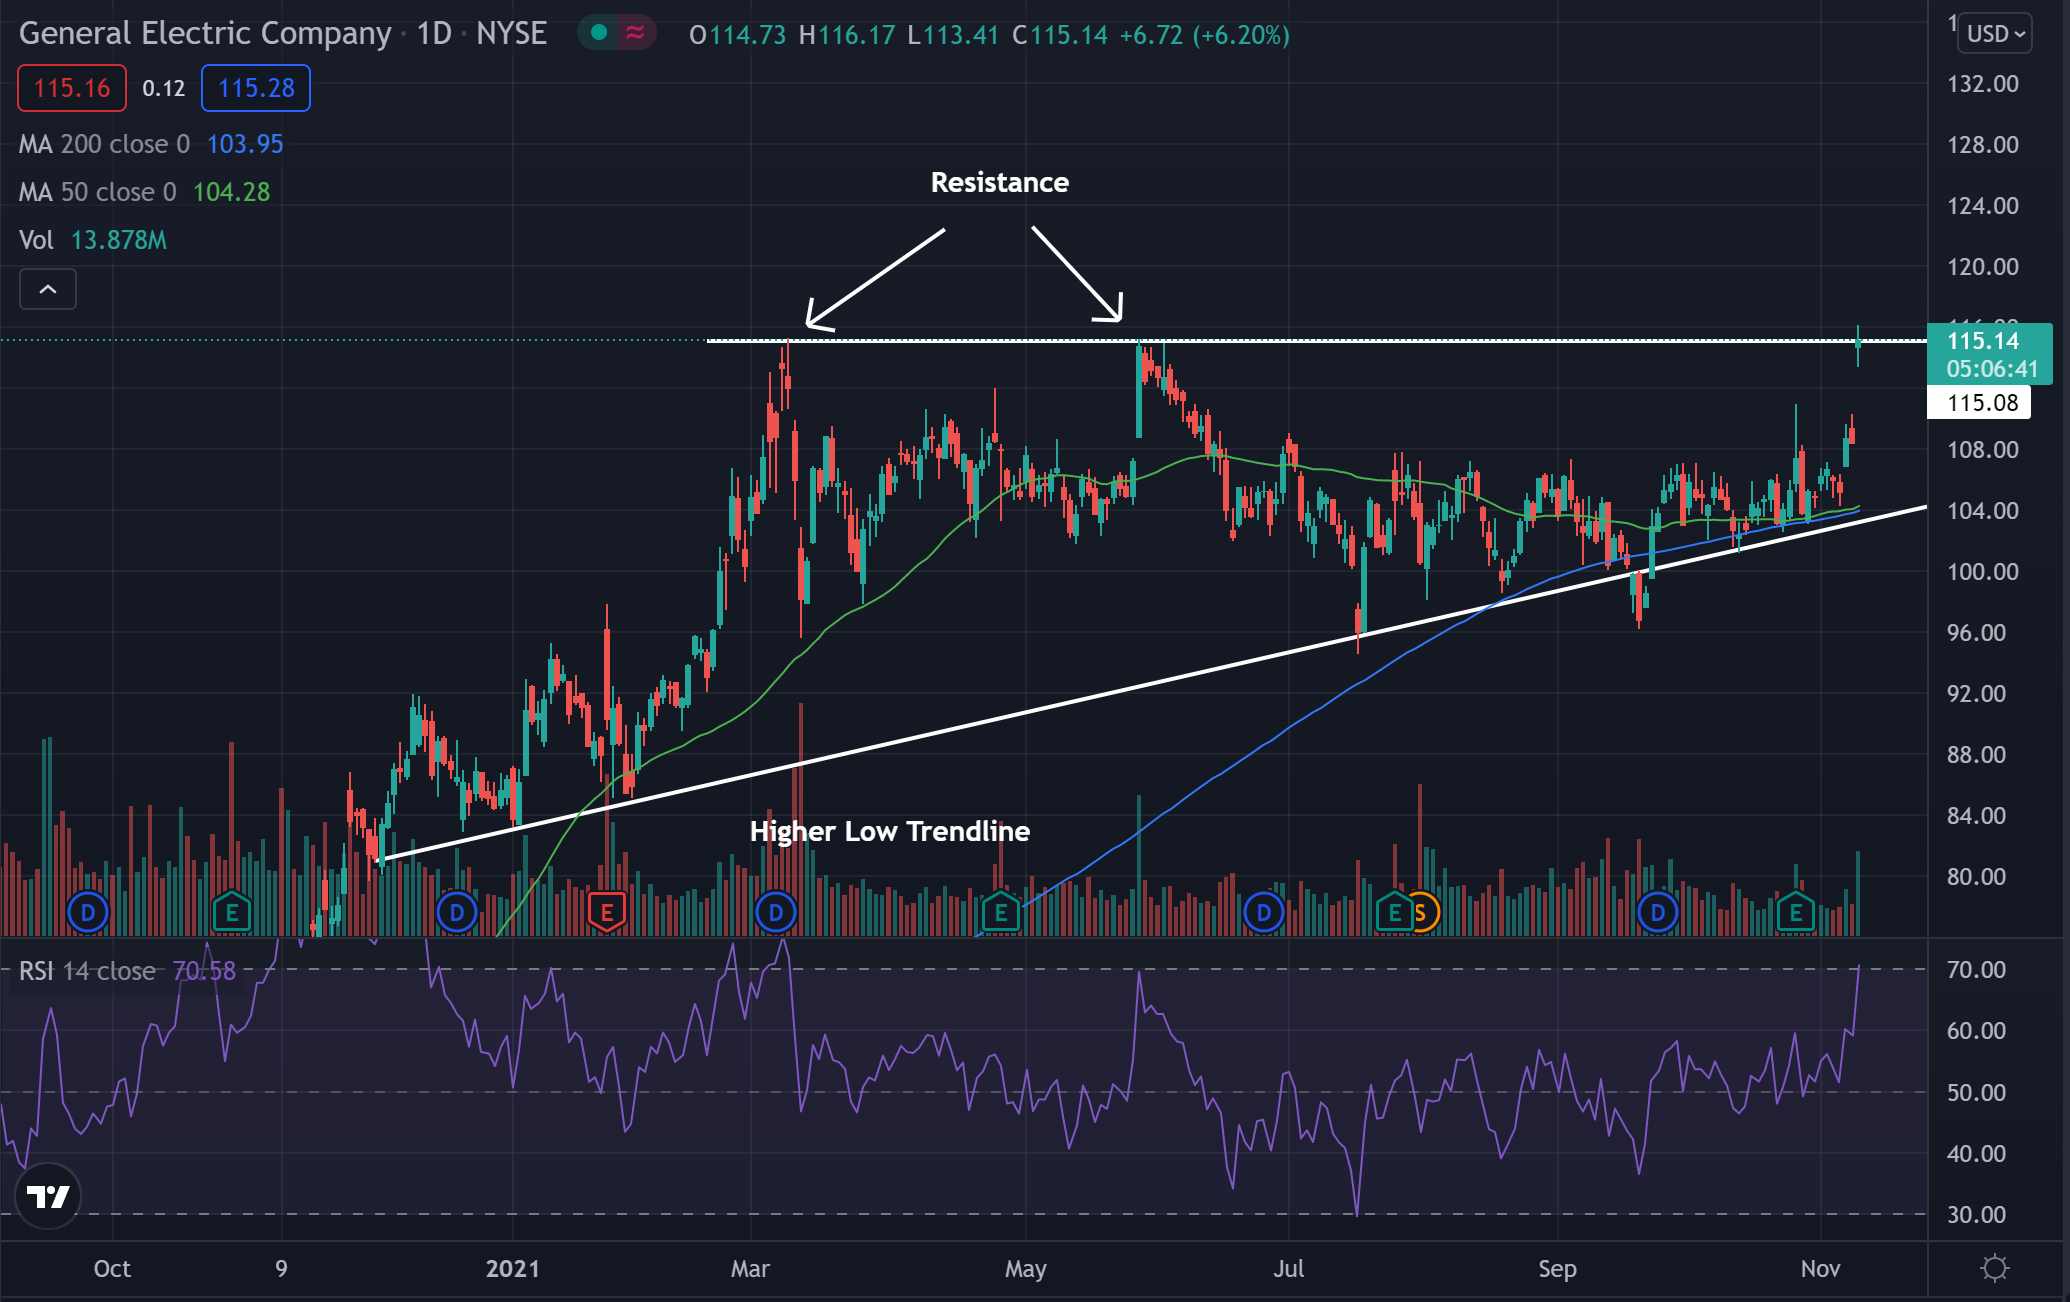
General Electric Co. GE shares were trading higher Tuesday after the company announced it plans to form three global public companies focused on the growth sectors of aviation, health care and energy.
General Electric was up 3.87% at $112.62 midday Tuesday.
General Electric Daily Chart Analysis
- The stock saw a large gap up Tuesday morning to a resistance level in what technical traders call an ascending triangle pattern.
- The higher low trendline may continue to hold as support in the future for the stock while the $115 level has been acting as a place of resistance for a time. If the stock can break and hold above the $115 level, it may turn into an area of support in the future.
- The stock trades above both the 50-day moving average (green) and the 200-day moving average (blue), indicating the stock is in a period of bullish sentiment.
- Each of these moving averages may hold as a potential area of support in the future.
- The Relative Strength Index (RSI) made a large move higher and now sits at 70. This is right on the border of the overbought range, where the stock has seen many more buyers than sellers.
See Related:Why GE Is Trading Higher In Tuesday's Premarket

What’s Next For General Electric?
Bulls are looking to see the stock continue to rise and break above the resistance. Bulls would then want to see the stock go on to touch the resistance level as an area of support before making a large upward move.
Bears are looking to see the stock get rejected at the resistance level and start to fade back lower. Eventually bears would want to see the stock break below the higher low trendline to see a long term change of trend.
Edge Rankings
Price Trend
© 2025 Benzinga.com. Benzinga does not provide investment advice. All rights reserved.
Trade confidently with insights and alerts from analyst ratings, free reports and breaking news that affects the stocks you care about.