It is natural to want to try and find meaning to price movement. After all, the more we think we know, the more we may be positioned to profit.
This logic tends to be counterintuitive when it comes to the financial markets.
In reality, the opposite is true with good investing, particularly as everyday people managing our own funds and portfolio. The less we try and understand why and the more focus on charts and follow the long-term trends, the more profit we are set to make.
One of the main reasons for this approach is that institutions pay a lot of money to get news items early. These new items have already been traded on and factored into the market by the time we hear them, so trying to make sense of it is often futile.
The bull trend in play since 2009 also confirms that all news items, including the declines around COVID-19 last year, are being absorbed into the long-term trend. Bullish is the only stance you want to have until the markets dictate otherwise.
A bullish stance means applying patience and allowing these temporary declines to occur before the market finds support and pushes further onto new all-time highs.
Applying patience, after all, is a crucial skill of a master investor, one that is often overlooked or underappreciated.
Friday's Declines: Going back to last week, it seems the declines on Friday, Nov. 26 have been blamed on the news surrounding the new omicron COVID-19 variant. There may be an element of truth to this.
After all, COVID-19 has swamped the news headlines since it first came to light back in 2019, which then caused the 35% declines in the market in the early part of 2020. Yet the markets have recovered by over 100% since then.
The chances of these recent moves being absorbed into the long-term bull trend are also high. Do take a moment to pay close attention to the language I am using. I am talking in terms of probabilities, not certainties. There are no guarantees in this game.
If we go in the direction of the established trend, we have a much higher chance of profiting in the long term. This approach is in line with one of the fundamentals of sound investing: the trend is your friend until the bend at the end.
The art as an investor is determining the difference between a pullback and a complete trend reversal. As often occurs, whenever there is any decline in the market, our media channels will resort to the usual rhetoric of the world coming to an end.
To bring an objective approach, I focus on price in relation to critical support levels in a bull trend.
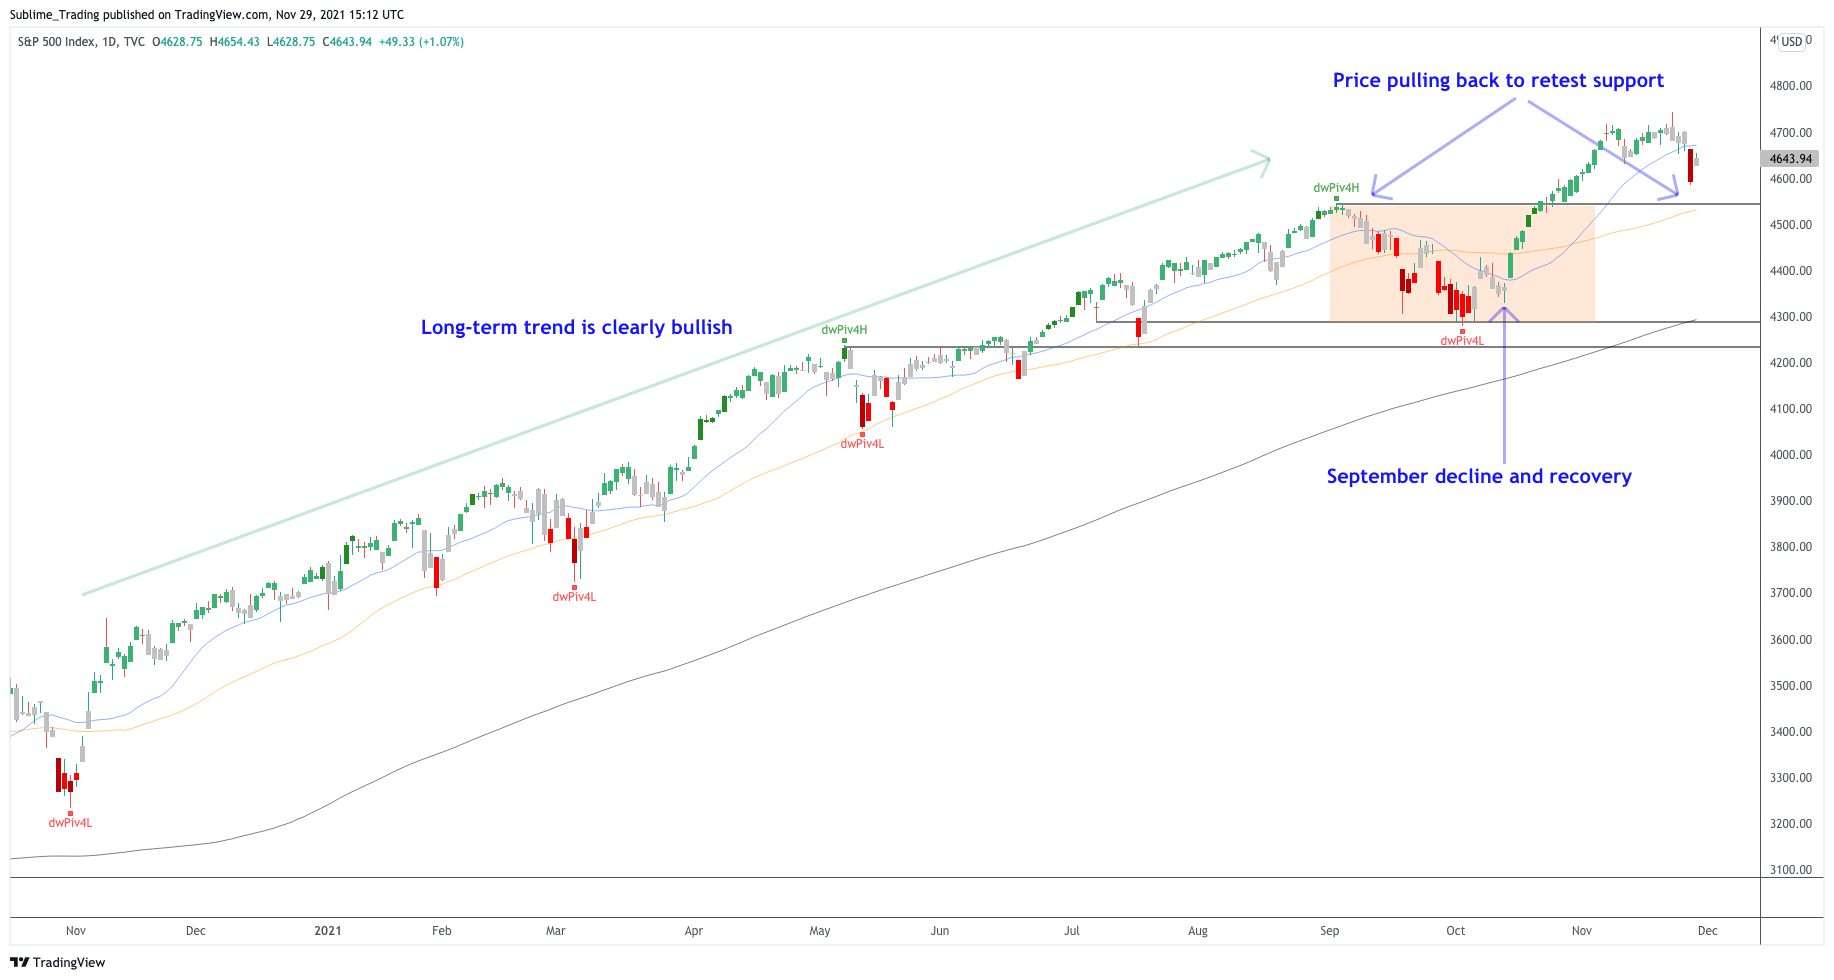
The S&P 500 And Support Levels: Below I have the daily timeframe of the S&P 500.

I have marked the high of September when price went through the customary seasonal declines that we expect at this time of year. September has a history of being the weakest month of the year.
Price, as we should expect going in the direction of the trend, found support, recovered and then broke out in October, going on to print new ATHs.
Looking closer at this structure, price failed to retest the high of September as resistance-turned-support. When price shoots through a level with a retest, the pullback to complete the retest is often aggressive.
This is what we are seeing for now.
As long as price can remain above the high of September, we are very likely to see price breakout and print further new ATHs as it targets the 5,000 round number.
I am now focusing on how November ends, expecting to see a Santa Claus rally as we approach the end of 2021. If price rises, I will continue to add bullish positions into my portfolio on the best-performing stocks.
If price declines, I have my exit management plan and I will react accordingly.
For now, I am applying patience and will let price dictate what course of action to take.
© 2025 Benzinga.com. Benzinga does not provide investment advice. All rights reserved.
Trade confidently with insights and alerts from analyst ratings, free reports and breaking news that affects the stocks you care about.