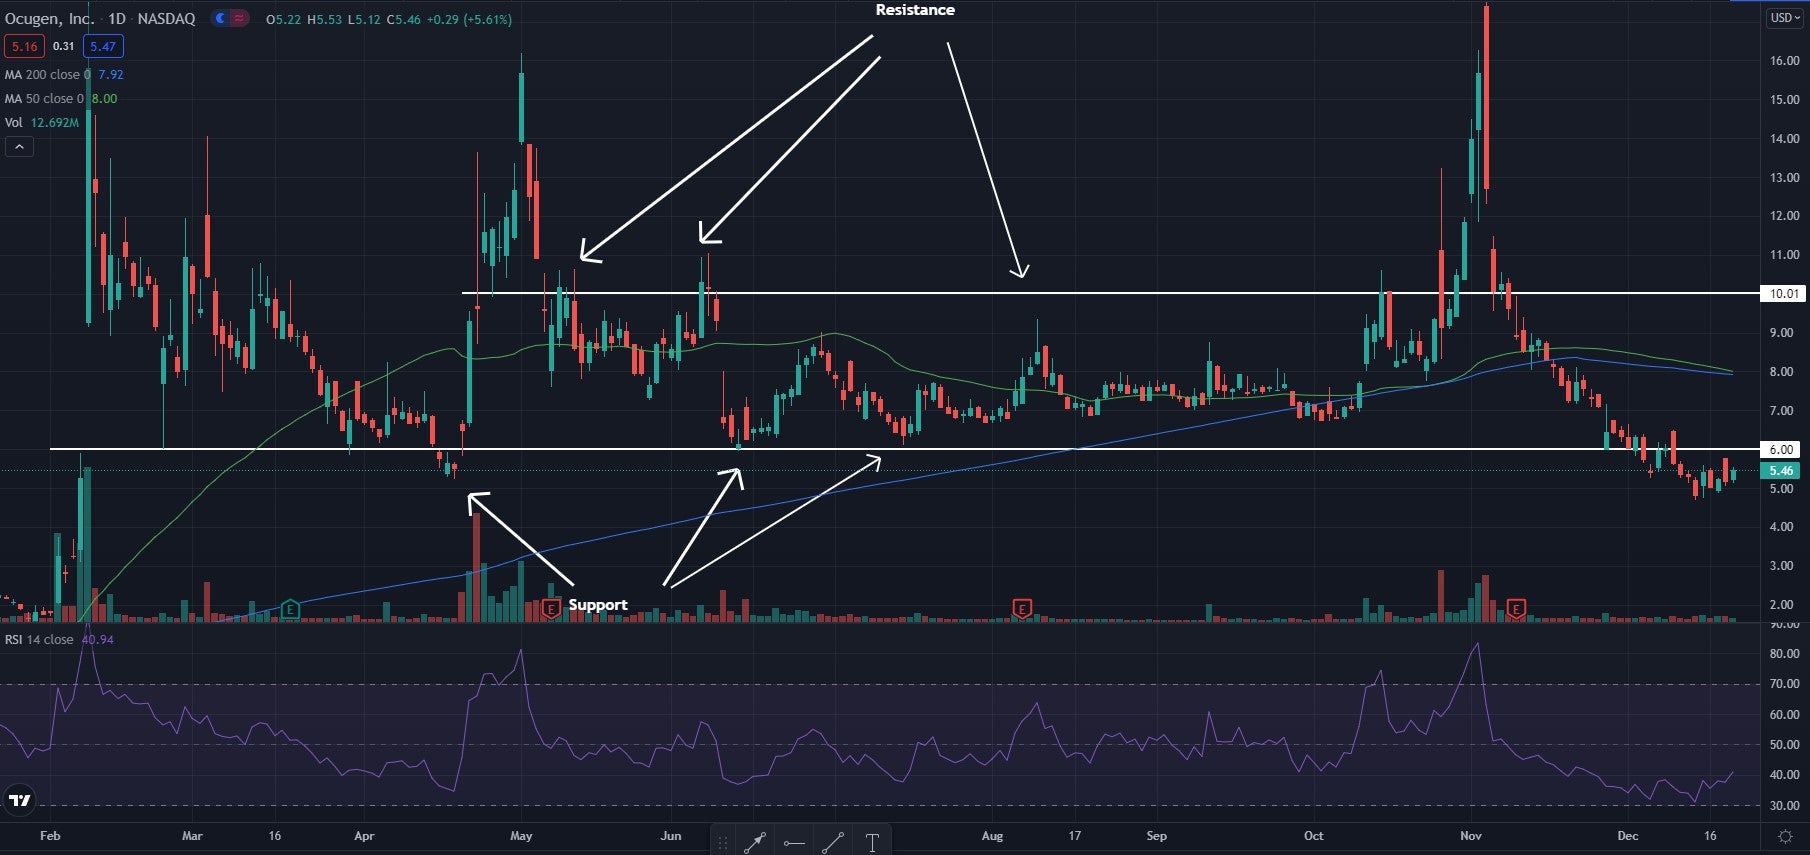
Ocugen Inc. OCGN shares are trading higher Tuesday as the stock attempts to recover a key support level. The stock looks to have no company specific news to explain the jump in price, but was trending higher on social media sites throughout the day.
Ocugen closed up 5.61% at $5.46.
See Also: What's Going On With Ocugen Stock Today
Ocugen Daily Chart Analysis
- The stock was trading in a sideways channel and the price looks to have recently fallen below the $6 support level that has held multiple times in the past. This area may become resistance in the future.
- If able to break back above the $6 level, resistance may be found near the $10 level as the stock previously struggled to cross above this area.
- The stock trades below both the 50-day moving average (green) and the 200-day moving average (blue). This indicates bearish sentiment, and each of these moving averages may hold as an area of resistance in the future.
- The Relative Strength Index (RSI) is curling higher and sits at 41. This shows the stock is beginning to see buyers move into it and could start pushing higher if the RSI continues to rise.

What’s Next For Ocugen?
Ocugen looks as though it may be beginning to curl and trade higher. If able to cross back above the $6 level the stock may start to look more bullish once again.
Bullish traders want to see the stock begin to form higher lows to show the uptrend. On the other hand, bearish traders want to see this $6 level become and area of resistance and want the stock to see a push back lower.
Edge Rankings
Price Trend
© 2025 Benzinga.com. Benzinga does not provide investment advice. All rights reserved.
Trade confidently with insights and alerts from analyst ratings, free reports and breaking news that affects the stocks you care about.