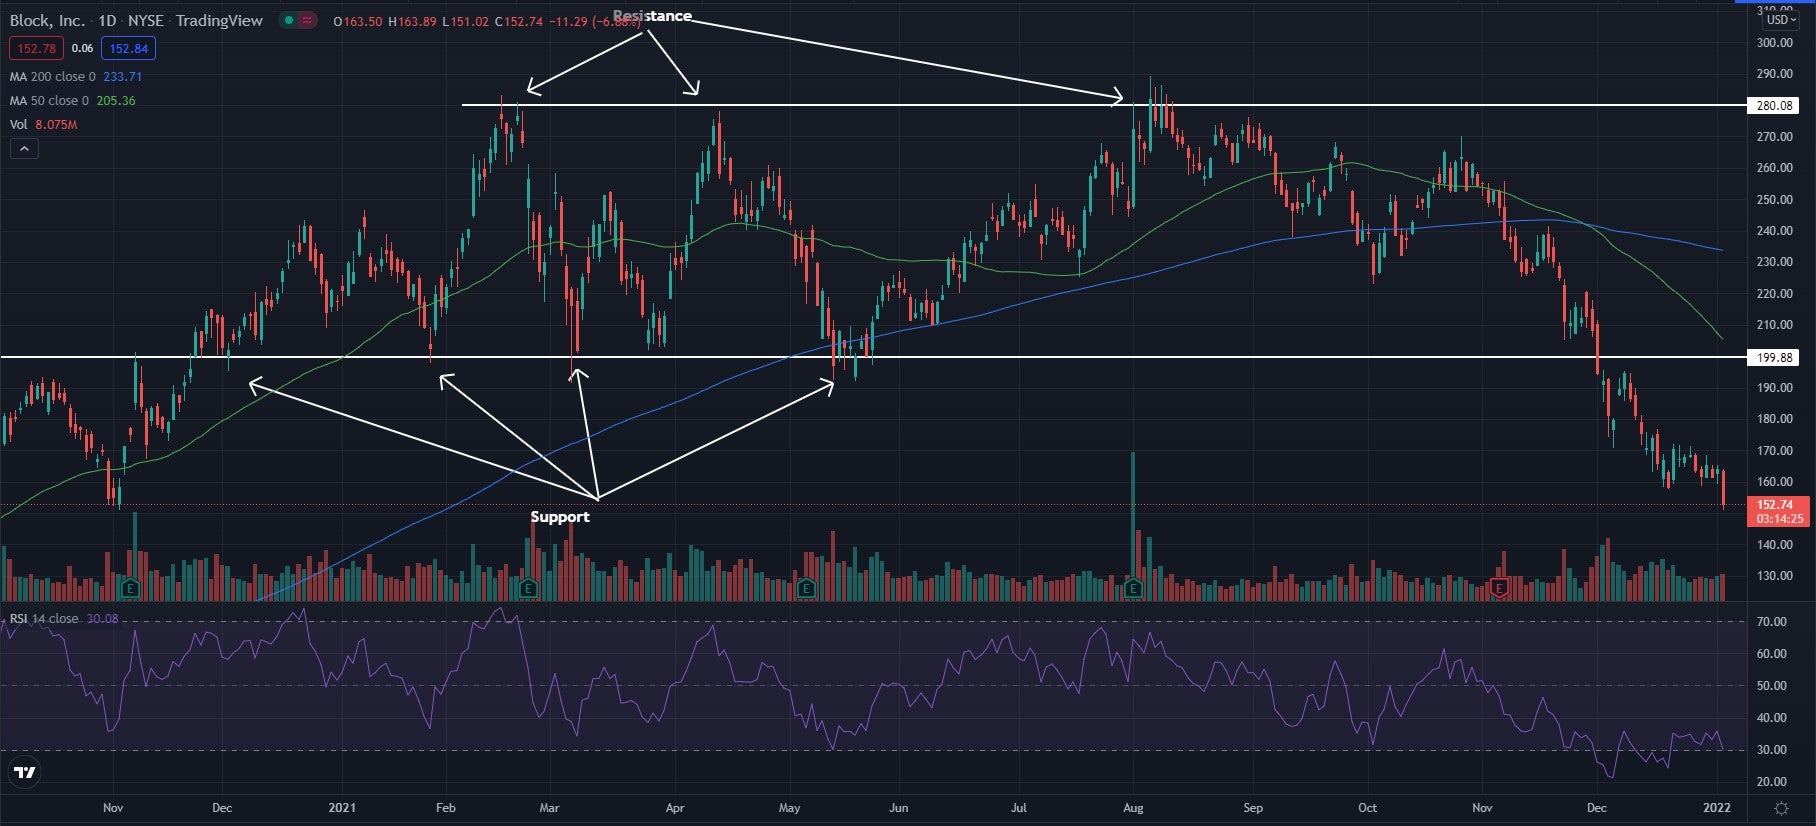
Block Inc. SQ shares were trading lower Tuesday as shares of tech and software stocks fall lower following a rise in U.S. Treasury yields, which has pressured growth sectors. The stock has made a strong move below support in the past few weeks.
Block was down 7.68% at $151.43 Tuesday afternoon.
See Related: Why Cathie Wood Sees Stocks Of Innovative Companies 'Maligned This Year' Be Rewarded 'Handsomely' In 2022
Block Daily Chart Analysis
- The stock was trading in a sideways channel and the price looks to have fallen below the $200 support level that has held in the past, and the price has since made a strong move lower. Resistance was found near the $280 level in the past and this level may continue to hold in the future.
- The stock trades below both the 50-day moving average (green) and the 200-day moving average (blue). This indicates bearish sentiment, and each of these moving averages may hold as an area of resistance in the future.
- The Relative Strength Index (RSI) has been moving sideways the in the last few weeks and sits at 30. This shows that sellers in the stock have been in control as the stock sits on the border of the oversold region.

What’s Next For Block?
The stock has been steadily falling since the break of support and has not shown any signs of slowing down yet. Bears are in control of the stock and are looking to see the stock continue falling and holding below the moving averages. Bulls are looking for a bounce and for the stock to start to form higher lows.
© 2025 Benzinga.com. Benzinga does not provide investment advice. All rights reserved.
Trade confidently with insights and alerts from analyst ratings, free reports and breaking news that affects the stocks you care about.