Taiwan Semiconductor Manufacturing Co. TSM shares were trading higher Thursday after the company announced better-than-expected fourth-quarter financial results and issued guidance above estimates.
The company reported quarterly earnings of $1.15 per share, beating the estimate of $1.12 per share. Revenue was reported at $15.74 billion, beating the estimate of $15.84 billion. The company expects first-quarter revenue to be between $16.6 billion and $17.2 billion versus the estimate of $15.84 billion.
Taiwan Semiconductors was up 6.5% at $140.88 Thursday afternoon.
See Also: Why Taiwan Semiconductor Shares Are Trading Higher Today
Taiwan Semiconductors Daily Chart Analysis
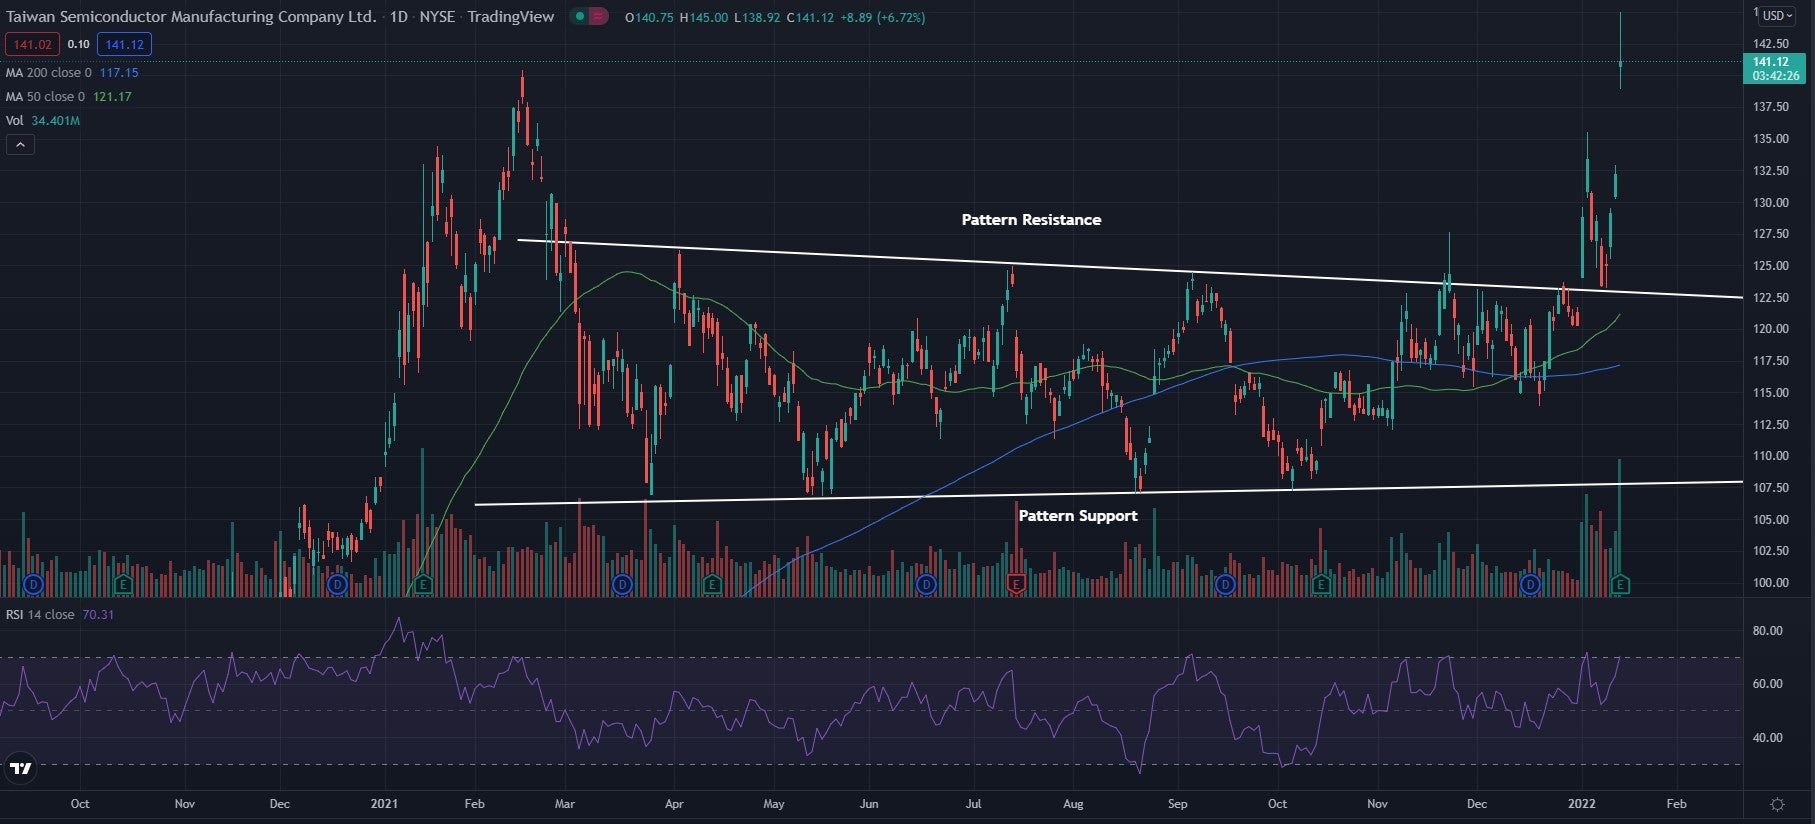
- Shares recently were able to break out of what traders call a pennant pattern and have been flying higher since. The stock was able to break past pattern resistance and then go on to test this level as an area of support before pushing higher in a textbook breakout.
- The stock trades above both the 50-day moving average (green) and the 200-day moving average (blue). This indicates the sentiment is bullish, and each of these moving averages may hold as an area of support in the future.
- The Relative Strength Index (RSI) has been trading sideways above the middle line for the past few months and sits at 70. This is on the border of the overbought region and shows there are many more buyers in the stock than there are sellers. If the RSI continues to climb, the price will most likely climb with it.

What’s Next For Taiwan Semiconductors?
The breakout and consolidation above resistance is a bullish sign as the stock sees the breakout. The RSI being high also shows that the stock is seeing a lot of strength. Bullish traders are looking to see the stock continue to push higher while the RSI keeps climbing to see the breakout continue.
Eventually the stock will cool off and consolidate, and bulls would like to see the stock hold its gains while consolidating. Bears are looking to see the stock start to fall and drop back below the pattern resistance and the moving averages.
© 2025 Benzinga.com. Benzinga does not provide investment advice. All rights reserved.
Trade confidently with insights and alerts from analyst ratings, free reports and breaking news that affects the stocks you care about.