A trait of a good investor is being able to select high-probability assets regardless of the asset name. This means having a proven analysis process that filters out the investment opportunities with the highest chance of returning a profit while staying 100% detached from the asset names.
Venture online, and you will often see the usual suspects that budding investors and traders follow. This list includes:
- Gamestop Corp. GME
- Bitcoin BTC/USD
- The EUR-USD
- Gold
- Oil
- Tons of penny stocks
- And Tesla Inc TSLA
A portfolio that performs consistently requires rebalancing periodically. This involves understanding when to let go of assets that are not performing, either in profit or loss, and adding new assets that are now displaying an edge.
An edge is when an asset has set up to offer more chance of returning a profit or a loss. For us as busy everyday people, the simplest and quickest way to define an edge is using technical analysis on the higher timeframes. This allows us to do less work but make more profit by holding and compounding, a process that also fits well around our busy lifestyles without any compromise on time and profit.
I have broken down how I define my edge using a simple checklist system that you can read here.
Let's Look At Tesla In Detail
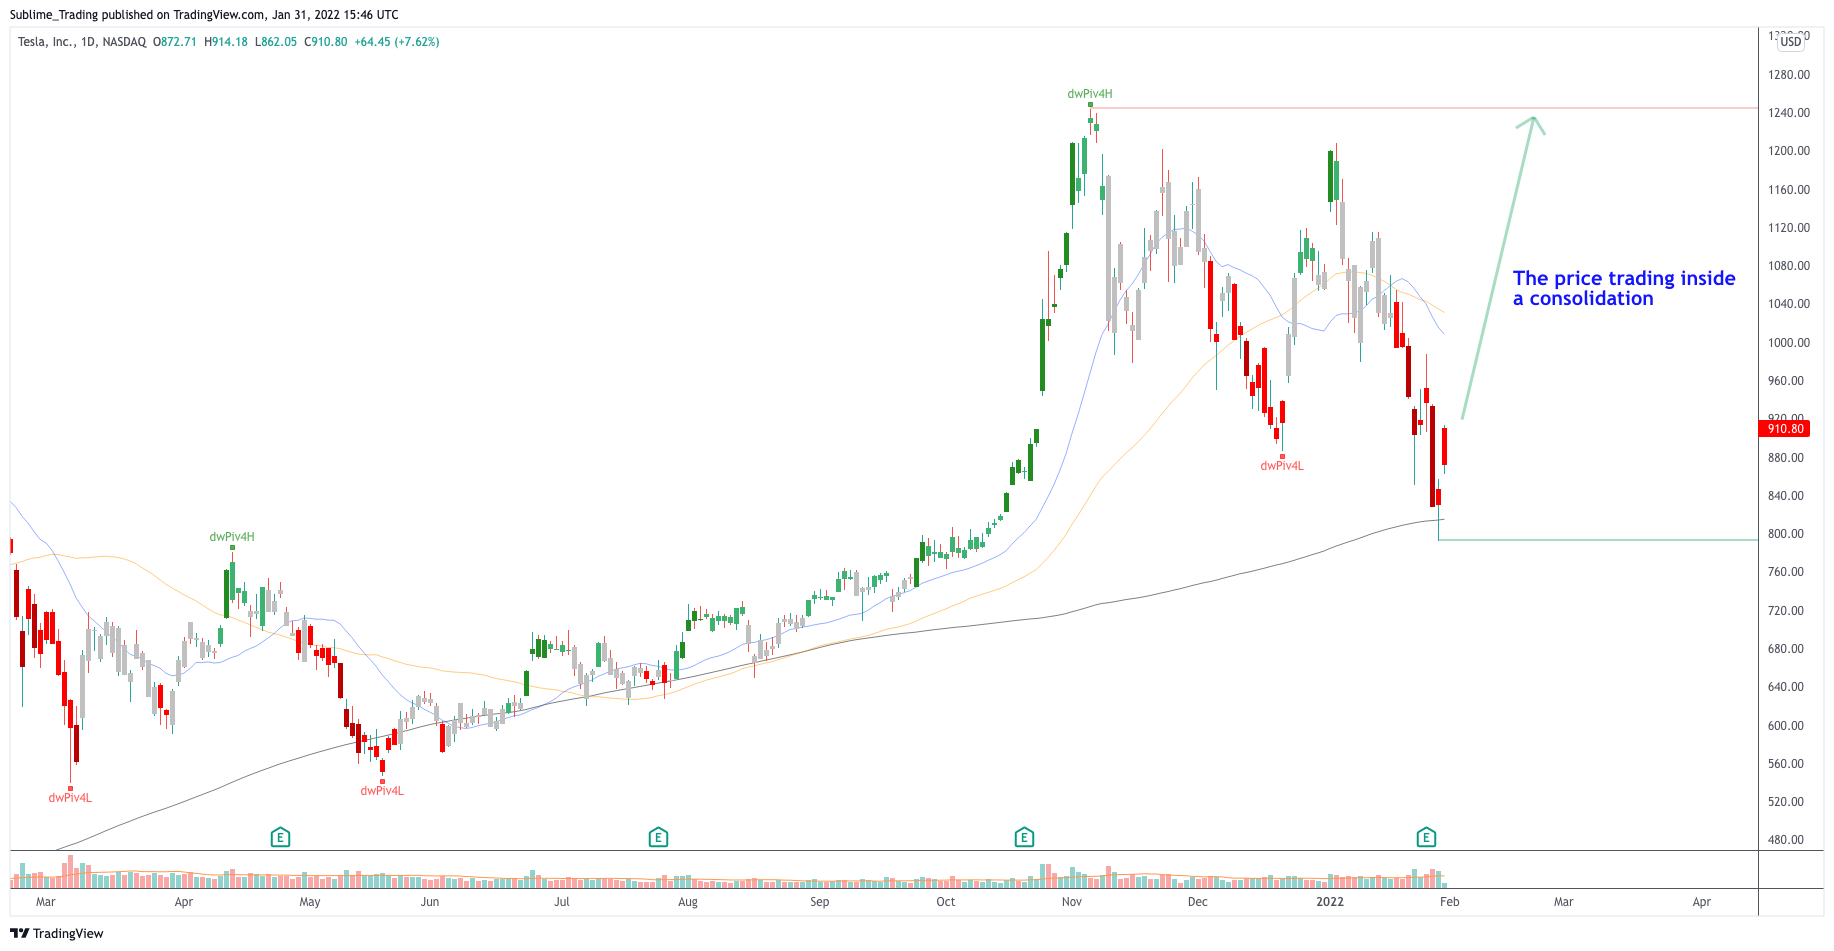
From the breakout in December 2019 at $78 to the high of $1,242 in November 2021, the price moved 1,510% — staggering growth that has rewarded early investors well.
The decline in January has seen the price drop by 36% to $800.
This means that the price is now stuck in a sideways market, also known as a consolidation, from which we need to see a breakout. The price took nine months to break out from the last period of consolidation between January 2021 and October 2021, an indication of how long this consolidation could last.
Below is the daily timeframe.

Let's Look At The Two Lesser-Known Stocks
The following is the essential criteria that an asset needs to meet for considering it for the portfolio. I find it works best by applying it to the monthly timeframe.
- A history of trending well, increasing the chances of the asset performing well in the future.
- Breaking out from an area of consolidation of at least three months, acting as a base for a long-term trend to develop.
- Printing new all-time highs, as there will be little in the form of resistance to cause a reversal other than a complete market reversal.
- The volume of at least 1 million confirming interest in the stock.
- Ideally, the price to be between $20 to $250, giving it good upside potential.
I am looking for the next Tesla or Amazon.com, Inc. AMZN stock, stocks that are cheap and that will move as smoothly as possible to the heights of these tech giants.
As a reminder, I am not concerned about the asset name but its potential, something that regularly gets overlooked if you get caught up in the noise around well-known brand names.
It would be best if you learned to separate the investor in you from the consumer.
Lesser-Known Stock No. 1: AmerisourceBergen Corp. ABC
Let's apply the above criteria:
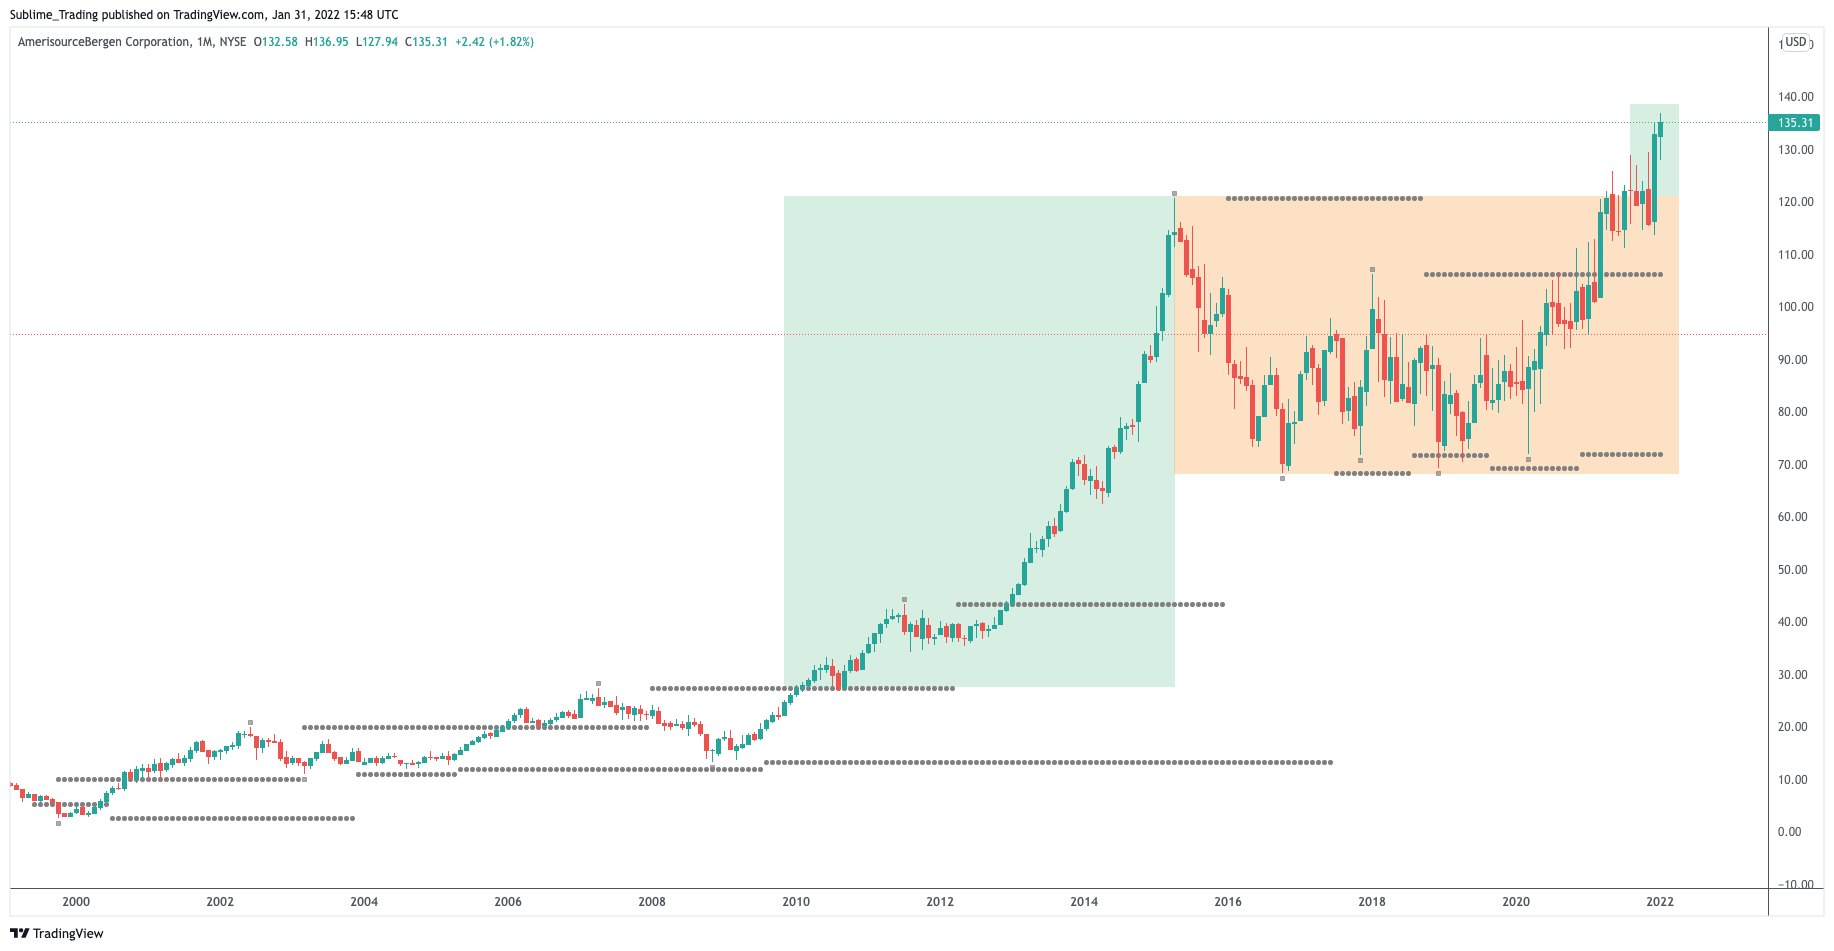
- Performed exceptionally well between 2010 and 2015, moving 340%.
- Price recently broke out from consolidation a six-year consolidation. Remember, the longer the consolidation, the bigger the breakout, and so this stock could move to serious heights.
- The stock is printing new ATHs. The next major resistance above price is the $200 round number.
- The volume is regularly around the 1-million mark.
- This is a cheap stock trading at $130.
Below is the monthly timeframe.

Lesser-Known Stock No. 2: McKesson Corporation MCK
Let's apply the above criteria:
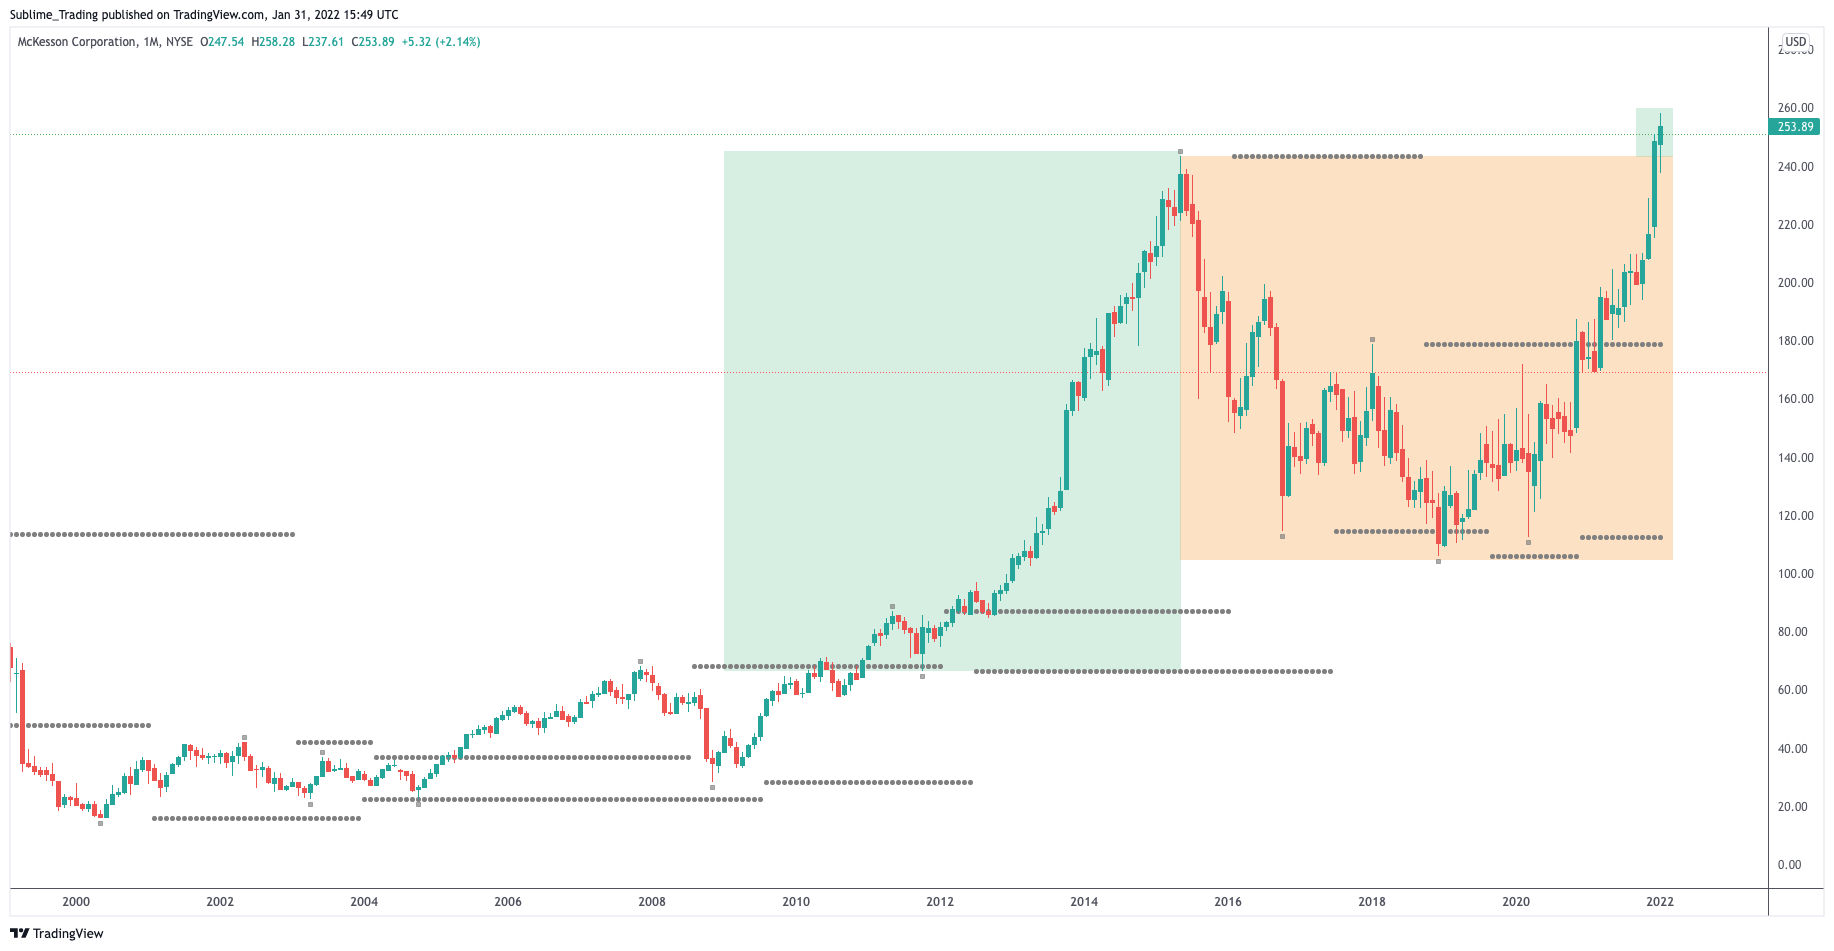
- Performed exceptionally well between 2010 and 2015, moving 252%.
- Price recently broke out from consolidation a six-year consolidation. Remember, the longer the consolidation, the bigger the breakout, so this stock could move to serious heights.
- The stock is printing new ATHs. The next major resistance above price is the $300 round number.
- The volume is regularly around the 1-million mark.
- This is still a relatively cheap stock trading at $130.
Below is the monthly timeframe.

These stocks are already in my portfolio with an initial risk of 2% each. I am now looking for the right opportunity to present itself to add further positions, also known as compounding.
As the saying goes, the trend is your friend until the bend at the end, and for these two stocks, the trends have only just started.
For more on our technical analysis and trend-following techniques, check out our website at sublimetrading.io.
Edge Rankings
Price Trend
© 2025 Benzinga.com. Benzinga does not provide investment advice. All rights reserved.
Trade confidently with insights and alerts from analyst ratings, free reports and breaking news that affects the stocks you care about.