Twitter Inc. TWTR shares are trading lower Thursday as many technology companies are trading in sympathy with Meta Platforms Inc. FB after the company reported worse than expected earnings.
Twitter's stock was down 6% at $34.30 at time of publication.
See Also: Meta Platforms Crashes On Earnings: What's Next For Facebook's Stock?
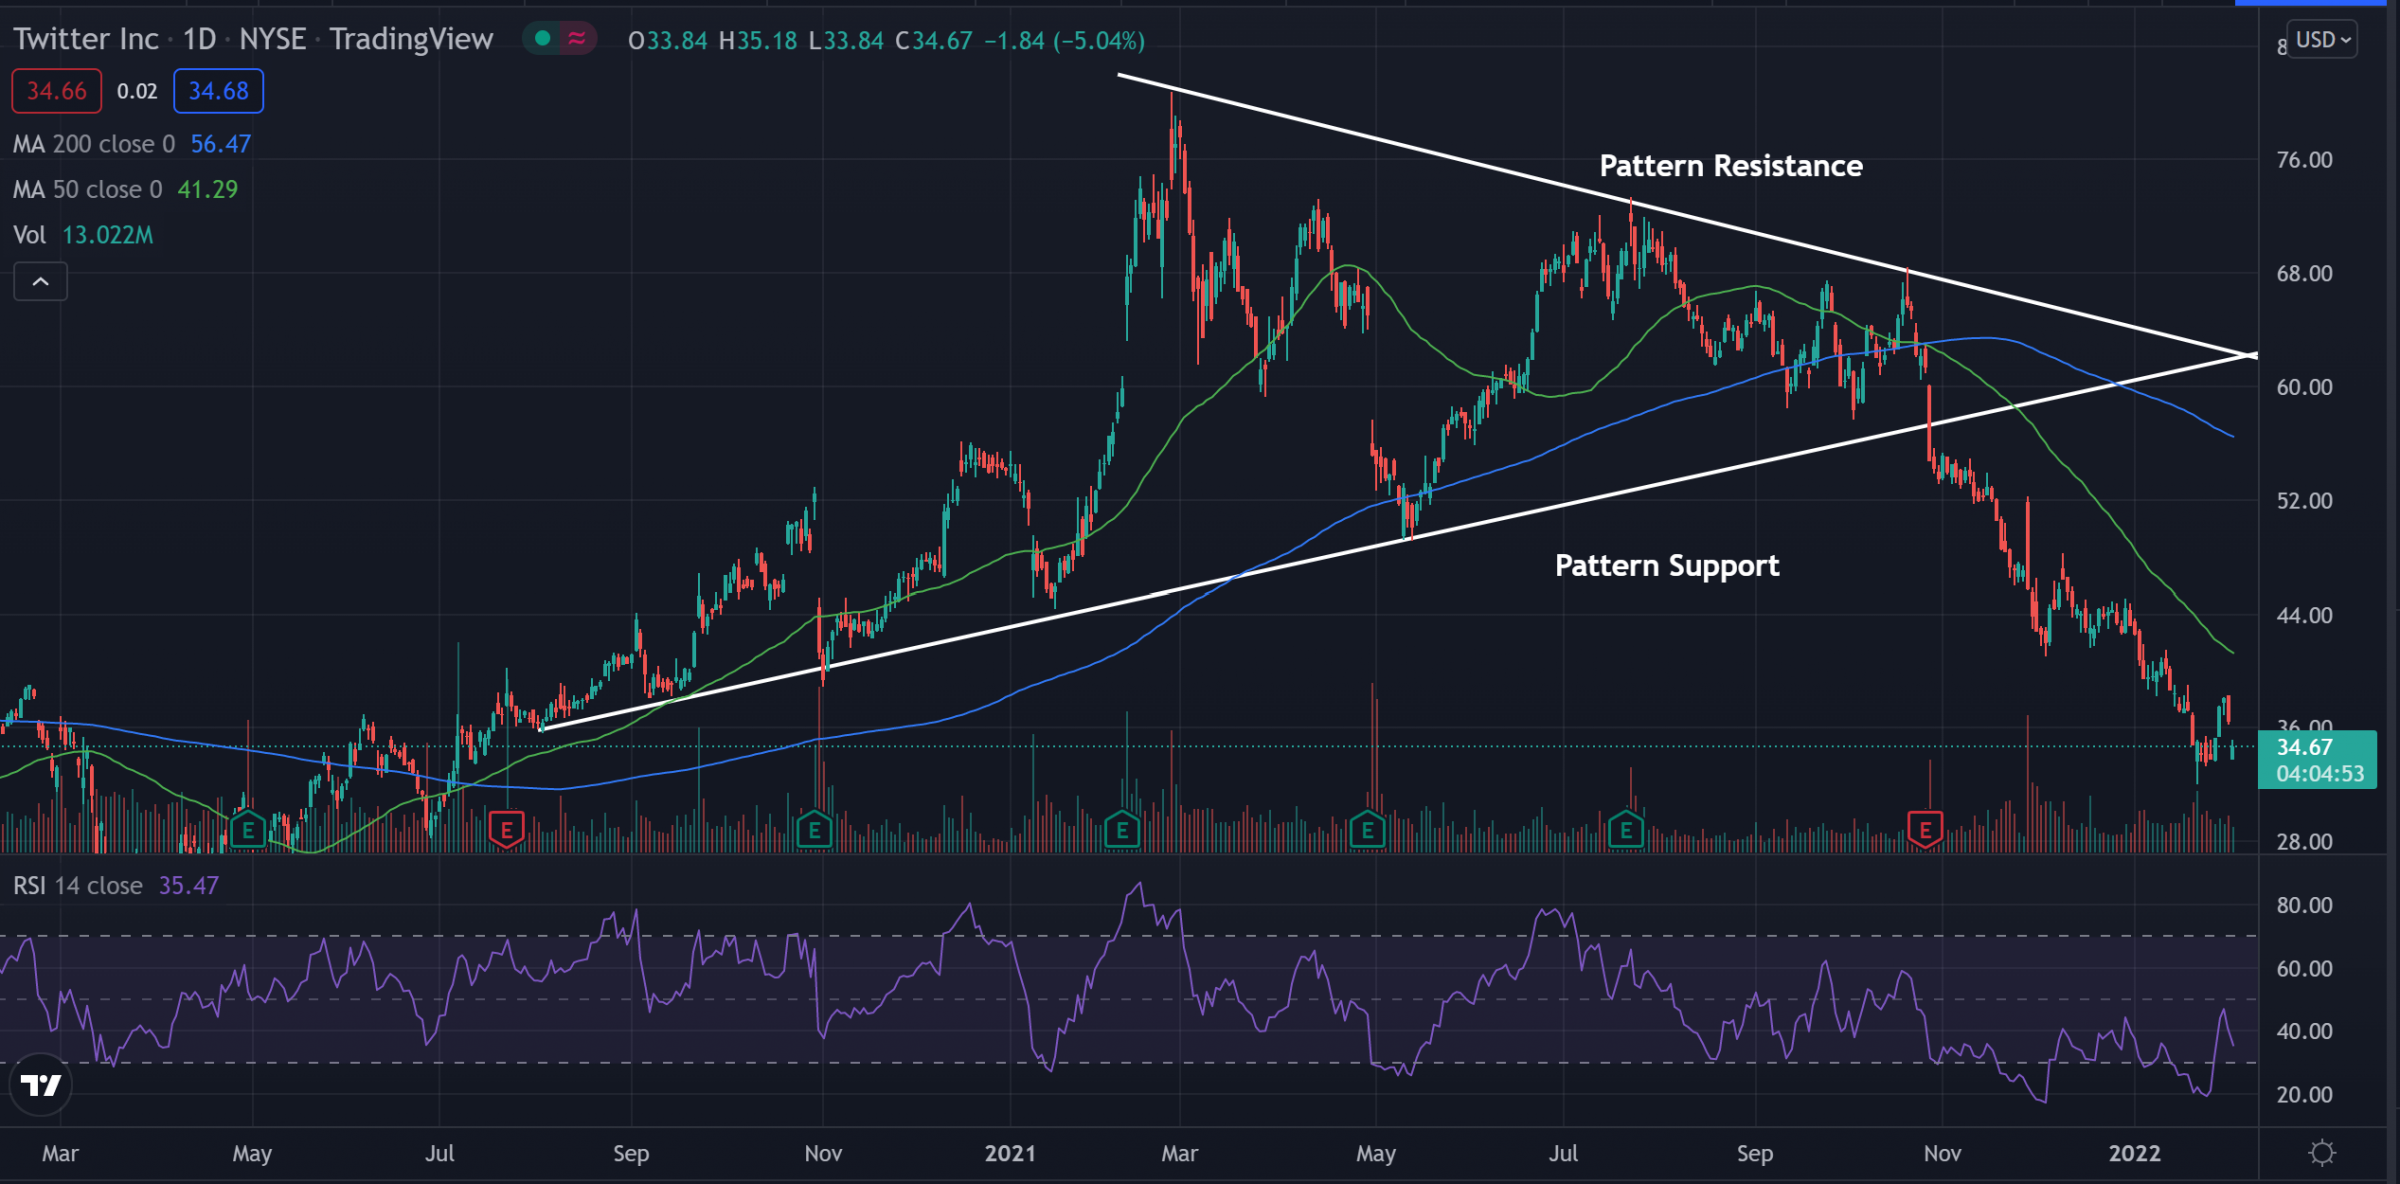
Twitter Daily Chart Analysis
- The stock has been falling lower for the past couple of months after it broke below support in a pennant pattern. Since the break, the stock has formed lower highs and has not yet been able to recover.
- The stock trades below both the 50-day moving average (green) and the 200-day moving average (blue). This indicates bearish sentiment, and each of these moving averages may hold as an area of resistance in the future.
- The Relative Strength Index (RSI) climbed over the last week, but has been falling since Thursday morning. The RSI sits at 35 on the indicator and shows that there is more selling pressure than there is buying pressure. The RSI nears the oversold region and the stock could see more selling if the RSI falls into this region.
What’s Next For Twitter?
Twitter continues to push lower in the downward trend it has been on for months. If the RSI stays low, this bearish trend may continue.
Bearish traders are looking for the downward trend to continue and for the RSI to continue to dip lower. Bullish traders are looking to see the stock begin to turn around and for the RSI to cross back above 50. Bulls then want to see a cross over the moving averages for a possible change in sentiment.
© 2025 Benzinga.com. Benzinga does not provide investment advice. All rights reserved.
Trade confidently with insights and alerts from analyst ratings, free reports and breaking news that affects the stocks you care about.

