Roblox Corp. RBLX shares are trading lower Thursday after the Bear Cave released a short report on the company. Shares recently fell below a key support level and are looking to rebound.
Roblox was down 6.47% at $61.89 Thursday afternoon.
Chart Wars: Roblox Vs. Electronic Arts — Which Stock Looks Game For A Move Higher?
Roblox Daily Chart Analysis
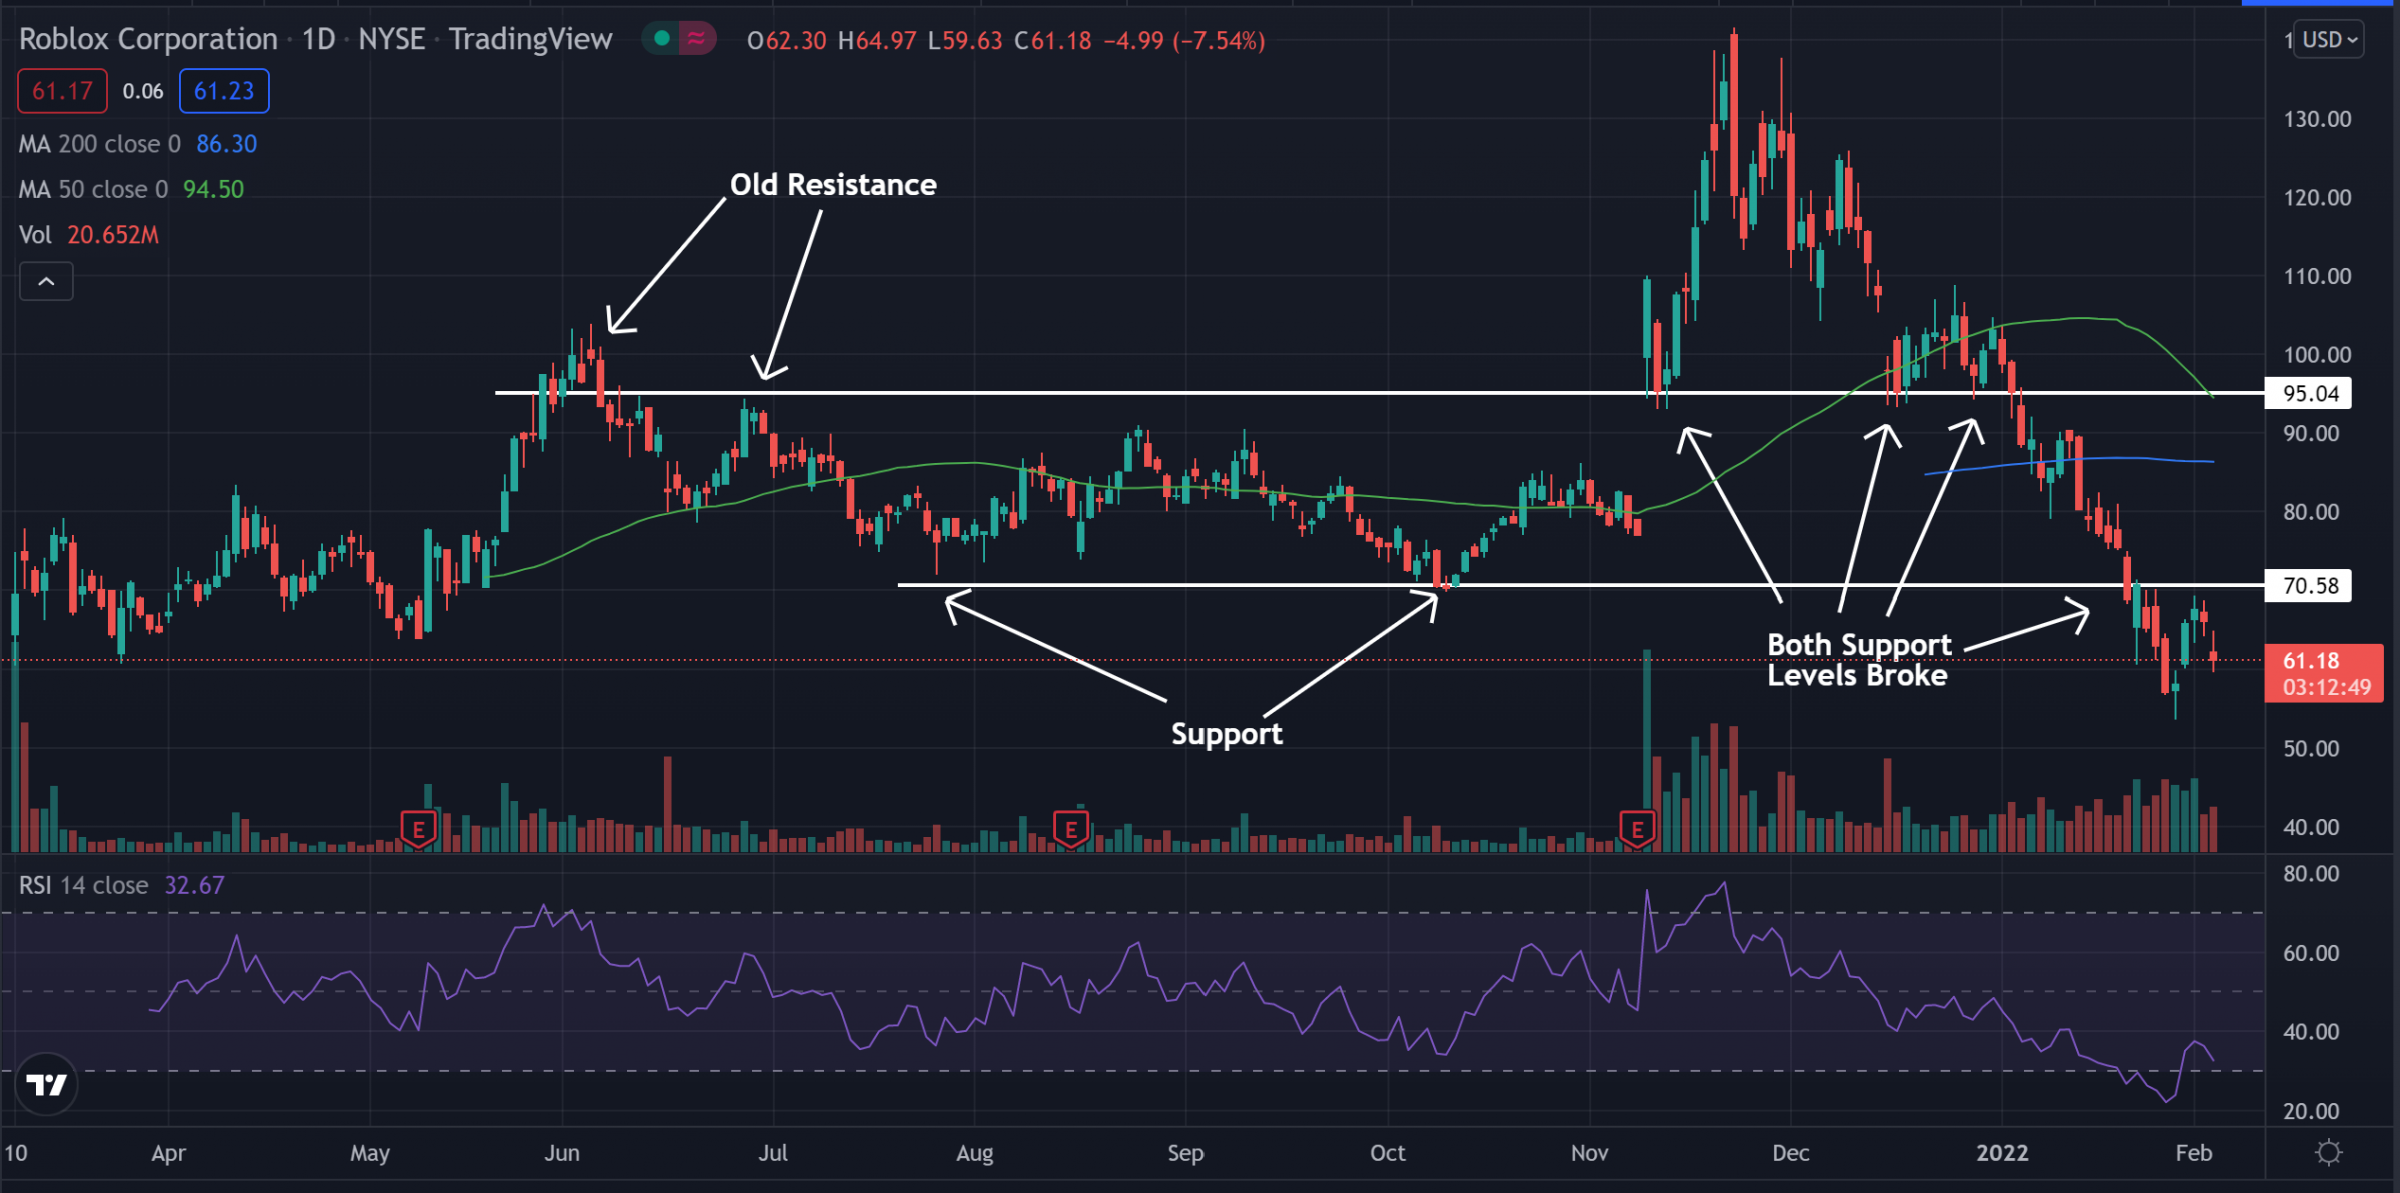
- The stock recently fell below the $70 support in a sideways channel and has started to hold the level as an area of resistance. Previously, resistance was found near the $95 level, but as it sits below both key levels they both may hold as an area of resistance.
- The stock trades below both the 50-day moving average (green) and the 200-day moving average (blue). This indicates bearish sentiment, and each of these moving averages may hold as an area of resistance in the future.
- The Relative Strength Index (RSI) has been on a steady downward trend for the past few months and sits at 32. This shows the stock is near the oversold region and is seeing more sellers than it is buyers. If the RSI remains low for an extended period of time, the price may continue to fade lower.

What’s Next For Roblox?
Roblox was unable to reclaim the $70 level and held it as resistance, which comes as a bearish sign to investors. The stock could continue to dip if the RSI stays low and the price cannot cross back above the $70 level.
Bearish traders are looking to see the RSI drop lower and for the stock to form lower highs. Bullish traders want to see the stock form higher lows and for the RSI to climb back above the middle line. Bulls want to see the price get back above the $70 level and hold above it to see possible further bullish moves.
Edge Rankings
Price Trend
© 2025 Benzinga.com. Benzinga does not provide investment advice. All rights reserved.
Trade confidently with insights and alerts from analyst ratings, free reports and breaking news that affects the stocks you care about.