Alibaba Group Ltd. BABA shares were trading lower Friday alongside other U.S.-listed Chinese tech companies as investors assessed the possible ripple effects from the escalating war between Russia and Ukraine.
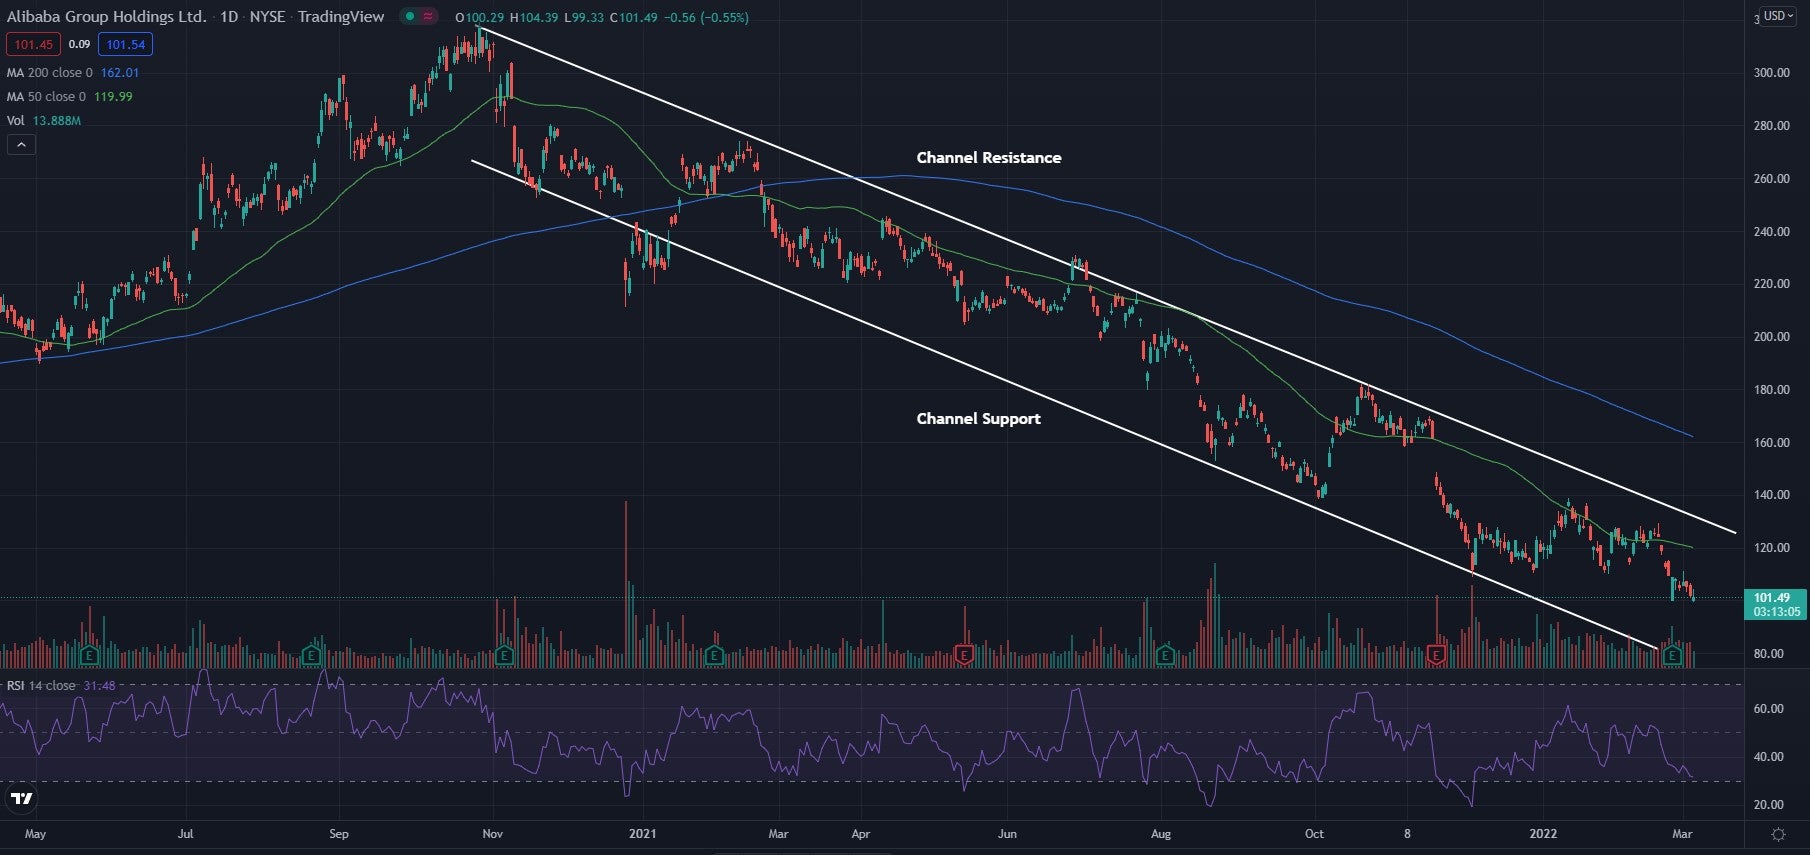
The stock continues to trade lower as the descending channel in which it has been trading in holds strong.
Alibaba was down 1.17% at $100.86 Friday afternoon.
See Also: Why Alibaba And Tesla Rivals Xpeng, Li Auto Are Crashing In Hong Kong Today
Alibaba Daily Chart Analysis
- The stock has fallen further in the descending channel and hasn't shown signs of turning around just yet. For the stock to make a reversal, it will need to break above the channel’s resistance and begin to form higher lows for a time.
- The stock trades below both the 50-day moving average (green) and the 200-day moving average (blue). This indicates bearish sentiment, and each of these moving averages may hold as an area of resistance in the future.
- The Relative Strength Index (RSI) has fallen lower the past few weeks and now sits at 31. This is right near the border of the oversold region. If the RSI can hold in the oversold region, the stock may continue to see strong bearish momentum.

What’s Next For Alibaba?
Alibaba hasn’t shown signs that it is ready for a reversal just yet. The stock continues to trade strongly lower in the downward trend. To see a reversal the stock will need to form higher lows and be able to break above the resistance in the channel.
Bullish traders are looking to see this break above the resistance level and see higher lows form. Bulls would then like to see the stock cross above the moving averages for sentiment to turn more bullish.
Bearish traders are in control of the stock and would like to see it continue to trade within the channel.
© 2025 Benzinga.com. Benzinga does not provide investment advice. All rights reserved.
Trade confidently with insights and alerts from analyst ratings, free reports and breaking news that affects the stocks you care about.