Bank Of America Corp. BAC shares are trading lower alongside other stocks in the financial services sector. Investors continue to weigh the economic impact of the conflict and Russian sanctions.
Bank Of America was down 5.35% at $38.76 at time of publication. Shares have dropped more than 20% over the past month.
See Also:Why This Investor Bought Bank of America Stock
Bank Of America Daily Chart Analysis
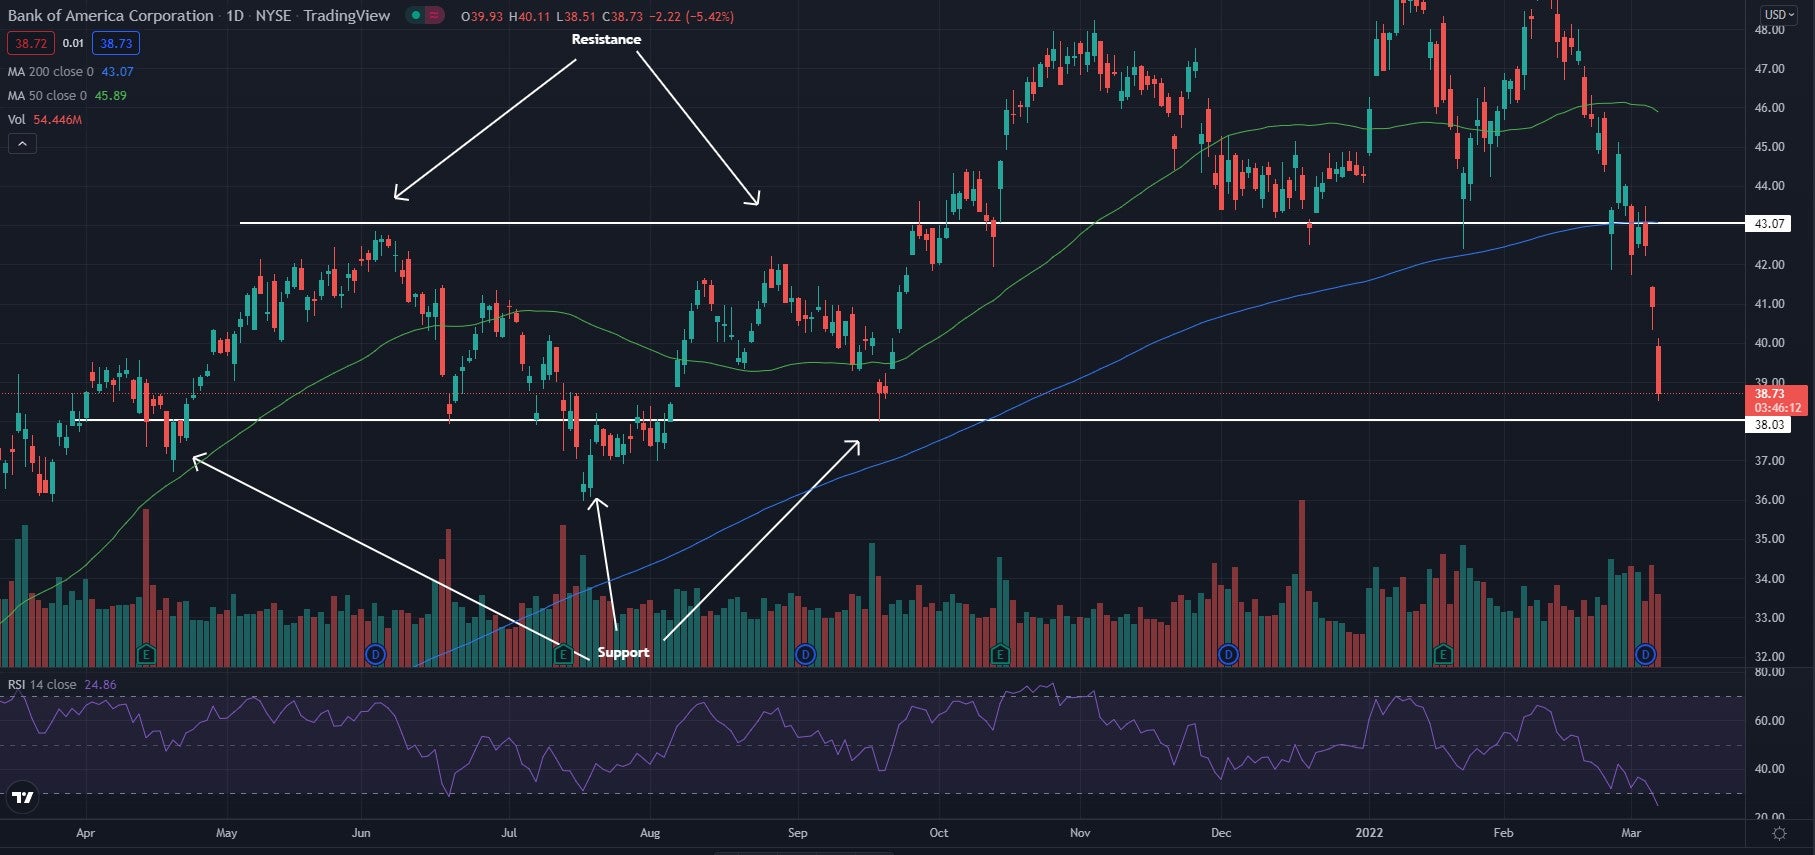
- Shares have been falling the past couple of weeks and are nearing support in a sideways channel. The $43 resistance in the channel was broken and began to hold as support. The few red days pushed the stock back below the level and it's nearing the $38 support in the channel.
- The stock trades below both the 50-day moving average (green) and the 200-day moving average (blue). This indicates bearish sentiment, and each of these moving averages may hold as an area of resistance in the future.
- The Relative Strength Index (RSI) has been pushing lower for the past couple of months and now sits at 25. This shows that the RSI has fallen into the oversold region, showing the stock is seeing many more sellers than it is buyers. If the RSI stays in the oversold region, the stock may continue to see strong selling pressure and move lower.

What’s Next For Bank Of America?
Bank of America is in a period of strong bearish movement. The stock is nearing support in the sideways channel it once traded in.
Bullish traders want to see a bounce off the $38 level and begin to head higher once again, forming higher lows along the way. Bearish traders want to see the stock continue to dip lower and fall below the $38 level. Bears then want to see the stock hold this price level as an area of resistance. If the $38 level became an area of resistance, the stock would most likely see a strong bearish push.
© 2025 Benzinga.com. Benzinga does not provide investment advice. All rights reserved.
Trade confidently with insights and alerts from analyst ratings, free reports and breaking news that affects the stocks you care about.