Camber Energy Inc CEI shares have been on a roller coaster Tuesday going back and forth trading higher or lower on a continued momentum and high volatility after the price of oil increased due to the Russia-Ukraine conflict. Energy names have been volatile amid the Russia-Ukraine conflict, which has lifted oil and gas prices due to supply concerns.
Camber Energy was down 0.78% at $1.27 Tuesday at publication.
See Also: Why Camber Energy, Indonesia Energy And Imperial Petroleum Shares Are Rising
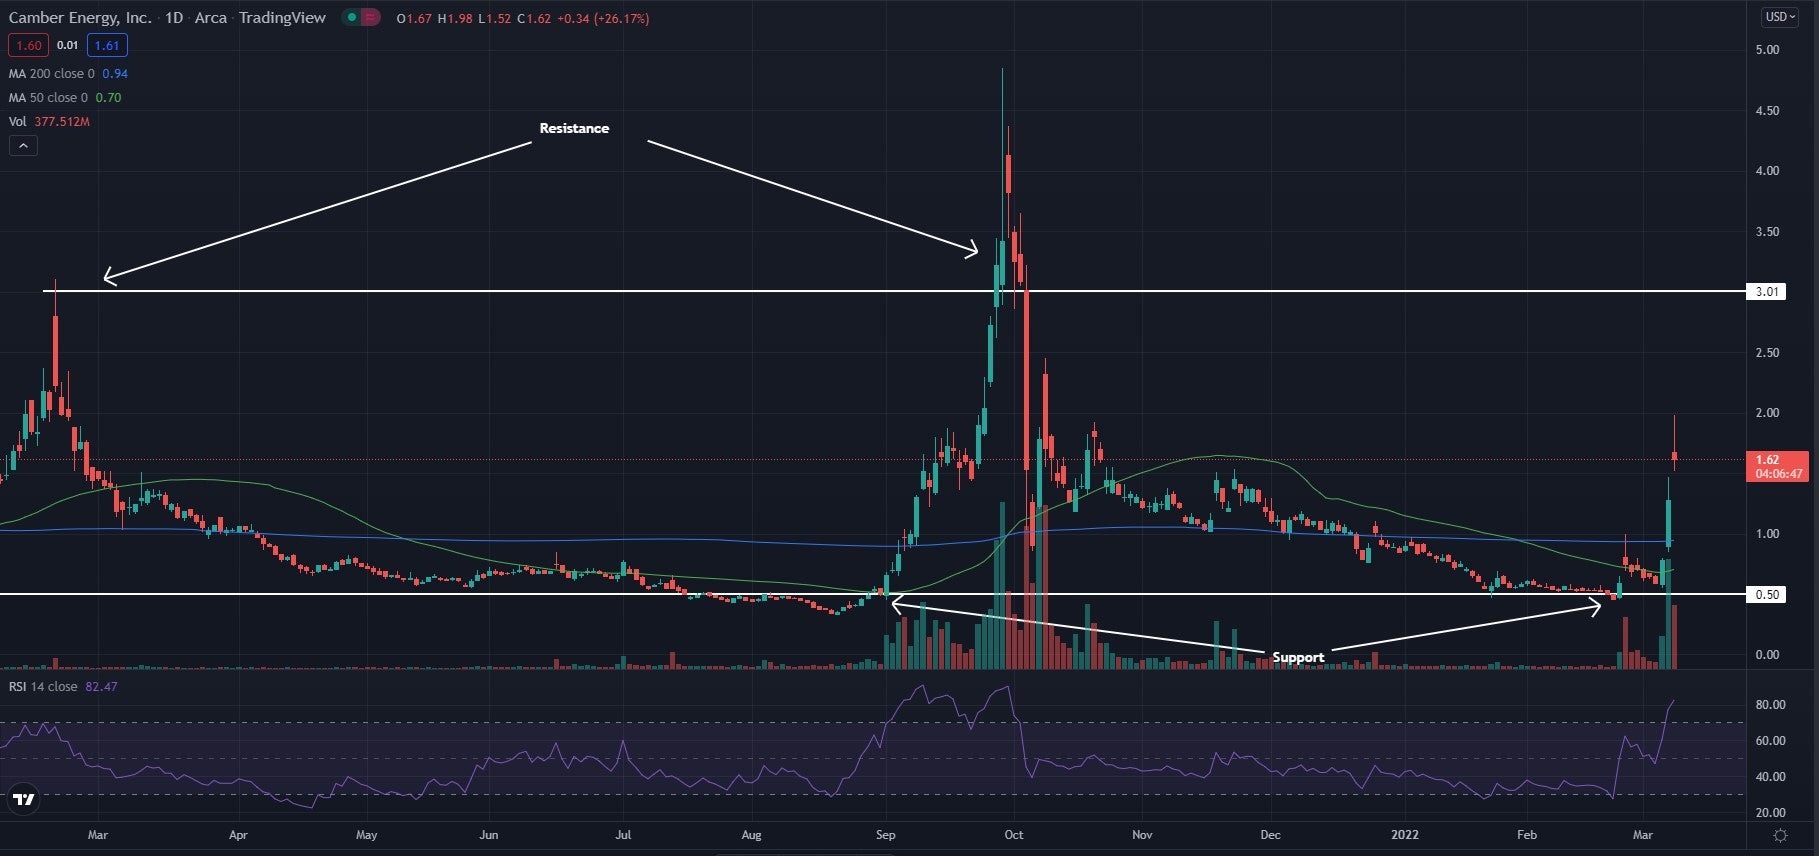
Camber Energy Daily Chart Analysis
- The stock has been flying higher the past few days in a sideways channel. The channel is showing support near the $0.50 area, and resistance near the $3 area. If the stock can continue to see buying pressure like it has in the past few days, it may test resistance soon. Strong green days likely will start to bring in sellers, so traders should take caution when thinking of opening a position.
- The stock trades above both the 50-day moving average (green) and the 200-day moving average (blue). This indicates bullish sentiment and each of these moving averages may hold as an area of support in the future.
- The Relative Strength Index (RSI) has been flying higher the past couple of weeks and now sits at 83. This RSI is well into the overbought range and is seeing many more buyers than it is sellers. If the RSI can hold in the overbought range the stock will most likely continue to climb.

What’s Next For Camber Energy?
Camber Energy is seeing some strong momentum as gas and oil prices have been rising. The rising RSI is a bullish sign that the stock may not be done moving. Seeing the strong upper wick on today’s candle shows that sellers were able to bring the price back down below the open, a possible bearish sign so traders should take caution. Bullish traders want the stock to continue to push higher and see the RSI remain overbought. The stock will likely have a period of strong bullish movement and fall quickly as it has in the past. Bearish traders want the stock to start turning around and head back toward the $0.50 level, crossing below the moving averages and seeing the RSI dip again.
© 2025 Benzinga.com. Benzinga does not provide investment advice. All rights reserved.
Trade confidently with insights and alerts from analyst ratings, free reports and breaking news that affects the stocks you care about.