Zinger Key Points
- NUGT is a double leveraged fund that is designed to outperform the NYSE Arca Gold Miners Index.
- If NUGT confirms its trading in a bear flag, the inverse ETF (DUST) may serve as a better play.
- Feel unsure about the market’s next move? Copy trade alerts from Matt Maley—a Wall Street veteran who consistently finds profits in volatile markets. Claim your 7-day free trial now.
Direxion Daily Gold Miners Index Bull 2X Shares NUGT shot up over 6% higher after the market opened, but the move higher was hampered by the general market, which saw the S&P 500 falling about 0.7%.
The gold miners sector recently enjoyed a long bull-cycle, which lasted from Jan. 28 to April 18 of this year and caused NUGT to soar 102% higher during that timeframe. Since late April, NUGT has erased all of its gains, however, plunging 63% from its 52-week high of $82.86.
NUGT is a double leveraged fund that is designed to outperform the NYSE Arca Gold Miners Index. The ETF tracks a number of gold and silver mining companies through its four holdings, with the VanEck Gold Miners ETF GDX and the U.S. Dollar making up 91.27% of its weighted holdings.
The other two funds making up the remainder of NUGT’s weightings are Goldman Sachs Trust Financial Square Treasury Instruments Fund Institutional, weighted at 8.49% and Dreyfus Government Cash Management Funds Institutional, with a 0.23% weighting.
It should be noted that leveraged ETFs are meant to be used as a trading vehicle as opposed to a long-term investment by experienced traders. Leveraged ETF’s should never be used by an investor with a buy and hold strategy or those who have low risk appetites.
Want direct analysis? Find me in the BZ Pro lounge! Click here for a free trial.
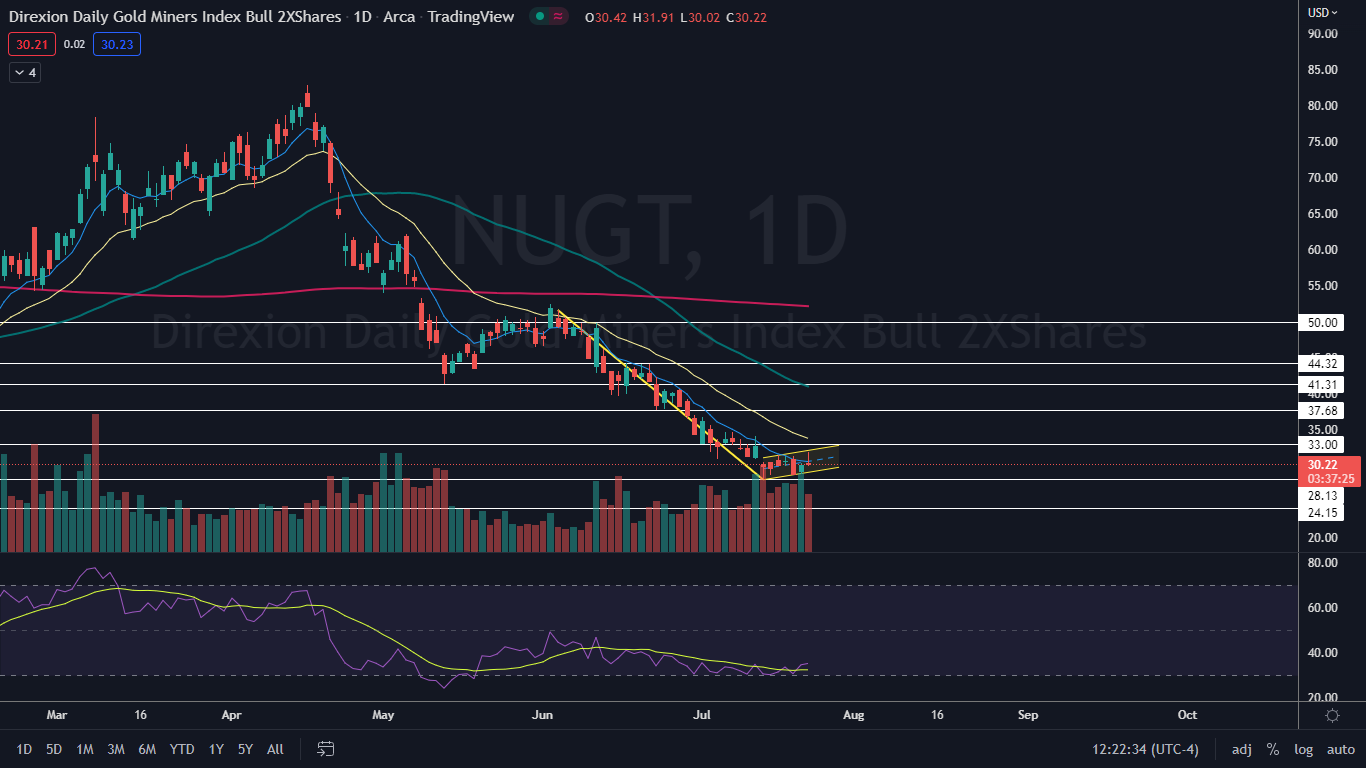
The NUGT Chart: Despite falling to trade mostly flat intraday on Friday, when NUGT reached its high-of-day, the ETF confirmed it's now trading in an uptrend by printing a higher high above the July 18 high of $31.52. On July 20, NUGT printed a higher low above the July 14 52-week low of $28.13, which negated the downtrend.
- NUGT is trading in a rising channel pattern between two parallel trendlines. The pattern is considered to be bullish unless the ETF breaks down from the lower ascending trendline on higher-than-average volume. Unfortunately, the rising channel paired with the steep downtrend that occurred between June 3 and July 14 may have settled NUGT into a bear flag pattern.
- If the bear flag pattern is recognized, traders may choose to take a position in the leveraged gold miners ETF bear, Direxion Daily Gold Miners Index Bull 2X Shares DUST.
- NUGT is trading below the eight-day and 21-day exponential moving averages (EMAs), with the eight-day EMA trending below the 21-day, both of which are bearish indicators. The ETF is also trading under the 50-day and 200-day simple moving averages, which indicates gold is currently in a bear market.
- NUGT has resistance above at $33 and $37.68 and support below at $28.13 and $24.15.

See Also: Eliminating Buy And Hold Myths
Edge Rankings
Price Trend
© 2025 Benzinga.com. Benzinga does not provide investment advice. All rights reserved.
Trade confidently with insights and alerts from analyst ratings, free reports and breaking news that affects the stocks you care about.