Zinger Key Points
- Etsy beat earnings estimates on both the top and bottom line.
- The stock is trading in a strong uptrend and may be ready to print its next higher low.
- Every week, our Whisper Index uncovers five overlooked stocks with big breakout potential. Get the latest picks today before they gain traction.
Etsy, Inc ETSY was surging over 10% higher at one point Thursday after printing a big second-quarter earnings beat.
The handmade and vintage e-commerce platform reported EPS of 51 cents on revenue of $585.14 million. Both numbers topped consensus analyst estimates of 34 cents and $557.25 million, respectively.
Etsy’s revenue increased 10.6% from the same period last year, mostly due to the company raising its sellers fee from 5% to 6.5% in April.
The stock has been heavily beaten down, having plunged 78% from the Nov. 26, 2021 all-time high of $307.75 to reach a 52-week low of $67.01 on June 16.
Despite soaring inflation, interest rate hikes and fear of a looming recession, Etsy appears to have found ways to excel in the environment, and on June 17 the stock reversed course into an uptrend.
Want direct analysis? Find me in the BZ Pro lounge! Click here for a free trial.
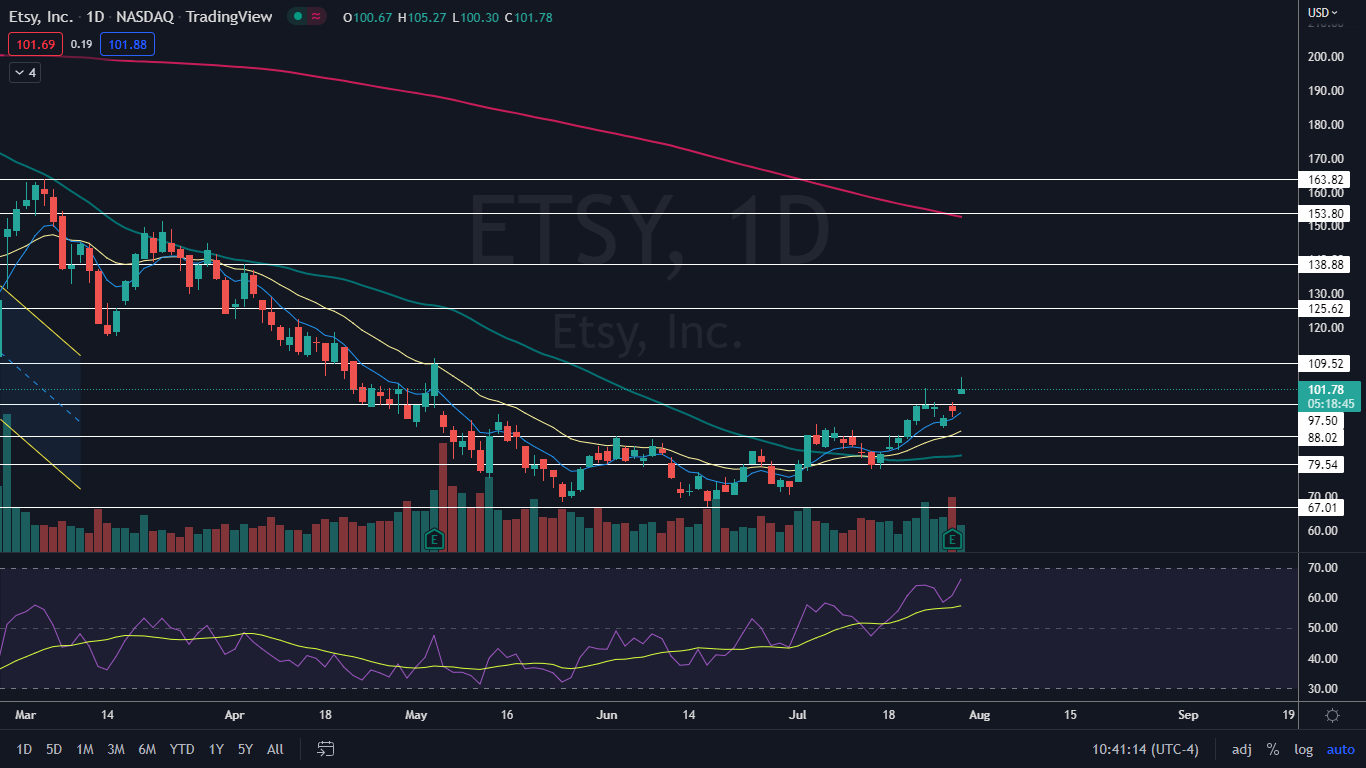
The Etsy Chart: Etsy’s most recent higher high within its uptrend was formed on July 22 at $102.12 and the most recent higher low was printed at the $90.17 mark on July 26. On Thursday when Etsy reached the high-of-day, the stock printed another higher high, which indicates the uptrend is intact.
- A pullback, to at least form another higher low, is likely to come over the next day or two because Etsy’s relative strength index (RSI) is measuring in at about 67%. When a stock’s RSI nears or reaches the 70% level it becomes overbought, which can be a sell signal for technical traders.
- If Etsy closes Thursday’s trading session with an upper wick, the stock will print a shooting star candlestick, which could indicate lower prices will come on Friday. The last time Etsy printed a shooting star candlestick on July 22 it signals the temporary high was in and the stock fell 6% over the two days that followed, to print a higher low.
- Etsy is trading above the eight-day and 21-day exponential moving averages (EMAs), with the eight-day EMA trending above the 21-day, both of which are bullish indicators. The eight-day EMA has been guiding the stock higher since July 18. Bearish traders will want to see that level lost before taking interest in Etsy.
- Etsy has resistance above at $109.52 and $125.62 and support below at $97.50 and $88.02.
 See Also: How to Read Candlestick Charts for Beginners
Photo via Shutterstock.
© 2025 Benzinga.com. Benzinga does not provide investment advice. All rights reserved.
Trade confidently with insights and alerts from analyst ratings, free reports and breaking news that affects the stocks you care about.