Zinger Key Points
- AMC is trading in a fairly consistent uptrend.
- A pullback is needed because AMC's RSI was approaching overbought territory.
- Feel unsure about the market’s next move? Copy trade alerts from Matt Maley—a Wall Street veteran who consistently finds profits in volatile markets. Claim your 7-day free trial now.
Benzinga recently asked its Twitter followers which stock they’re most focused on to end the week. From the replies, the editorial team selected one ticker for technical analysis.
Twitter users, including @theweb3god, @atif003gmailco1, Christy53558014, @The_Lion_Mind and @TheHenday, each responded to say they’re focused on AMC Entertainment Holdings Inc. AMC.
On Thursday after the market close, AMC posted mixed second-quarter financial results. The movie theatre chain reported revenue of $1.17 billion, which beat the consensus estimate of $1.16 billion and EPS of 20 cents, missing the estimate of 19 cents.
AMC also announced a special dividend, where for each share of AMC Class A common stock held on record as of Aug. 15, 2022, the holder will receive one AMC Preferred Equity Unit. The AMC Preferred Equity Unit will trade under the ticker “APE.”
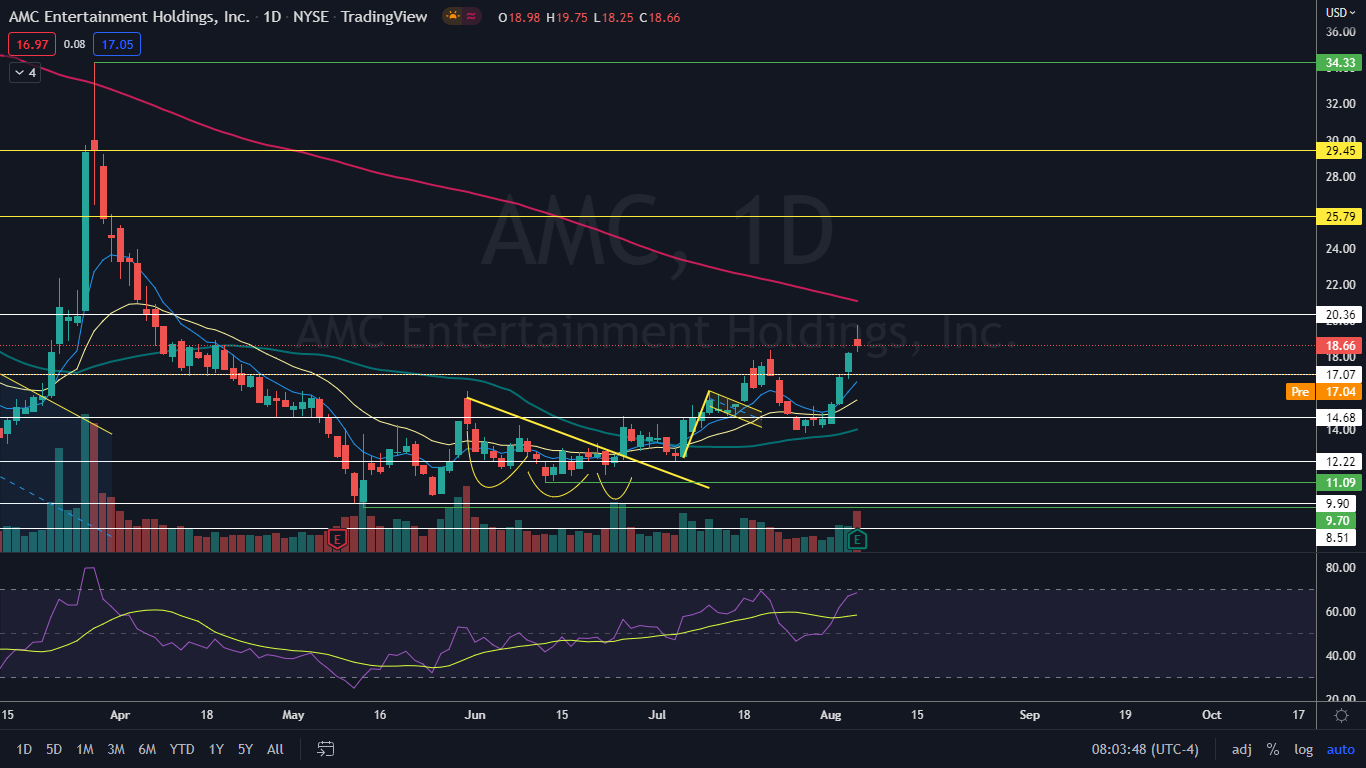
AMC was trading almost 10% lower in the premarket on Friday but not low enough to negate the fairly consistent uptrend the stock reversed into on June 13. The pullback is healthy because AMC has flashed several signals the stock needed to print a higher low.
Want direct analysis? Find me in the BZ Pro lounge! Click here for a free trial.
The AMC Chart: The most recent low in AMC’s uptrend was printed on July 27 at $13.82 and the most recent confirmed higher high was formed at the $18.37 mark on July 21. On Thursday, AMC printed an evening star candlestick, which indicates the next higher high is in and the stock will retrace.
The pullback was needed because AMC’s relative strength index (RSI) was measuring in at about 69%.
When a stock’s RSI reaches or exceeds the 70% level, it becomes overbought, which can be a sell signal for technical traders. When AMC’s RSI reached the same level on July 20, the stock pulled back 24% over the four trading days that followed.
- See Also: 'Today We Pounced': How AMC's New APE Shares Can Fight Off 'Prophets Of Doom Rooting Against' Company
- AMC is trading above the eight-day and 21-day exponential moving averages (EMAs), with the eight-day EMA trending above the 21-day, both of which are bearish indicators. The stock is also trading above the 50-day simple moving average (SMA), which indicates longer-term sentiment is bearish.
- Bullish traders will want to see AMC hold above the moving averages, especially the eight-day EMA, on the pullback.
- If AMC holds above the level and continues to trend higher in its uptrend, the stock will eventually regain the 200-day SMA, which would throw the stock into a confirmed bull cycle.
- AMC has resistance above at $20.36 and $25.79 and support below at $17.07 and $14.68.

Edge Rankings
Price Trend
© 2025 Benzinga.com. Benzinga does not provide investment advice. All rights reserved.
Trade confidently with insights and alerts from analyst ratings, free reports and breaking news that affects the stocks you care about.