Zinger Key Points
- AMC Entertainment regained the 200-day SMA, throwing the stock into a bull cycle.
- All three stocks are in need of a pullback because their RSIs have become extended to the upside.
- Feel unsure about the market’s next move? Copy trade alerts from Matt Maley—a Wall Street veteran who consistently finds profits in volatile markets. Claim your 7-day free trial now.
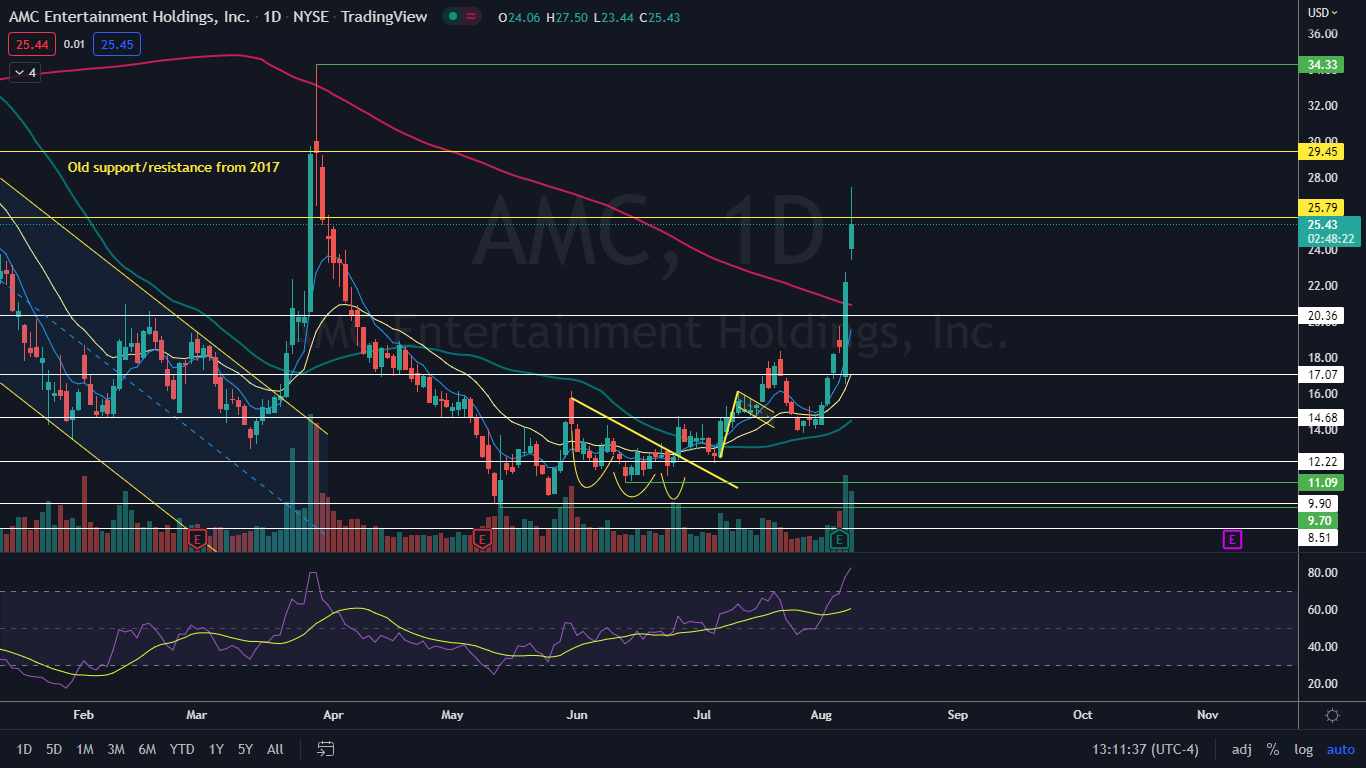
AMC Entertainment Holdings, Inc AMC surged about 25% at one point on Monday as the stock continued to trade higher in its uptrend, which Benzinga predicted in an Aug. 5 analysis.
On Friday, AMC regained the 200-day simple moving average (SMA) as support, which indicates a new bull cycle for the stock may be on the horizon, although AMC is in desperate need of consolidation.
When AMC printed its quarterly earnings on Aug. 4, the company announced a special dividend of preferred stock, which may be helping to boost the company. For each share of AMC Class A common stock held on record as of Aug. 15, 2022, the holder will receive one AMC Preferred Equity Unit that will trade under the ticker “APE.”
AMC’s 30% rally on Friday appears to have set off a short squeeze in a number of other stocks that are highly popular with retail traders.
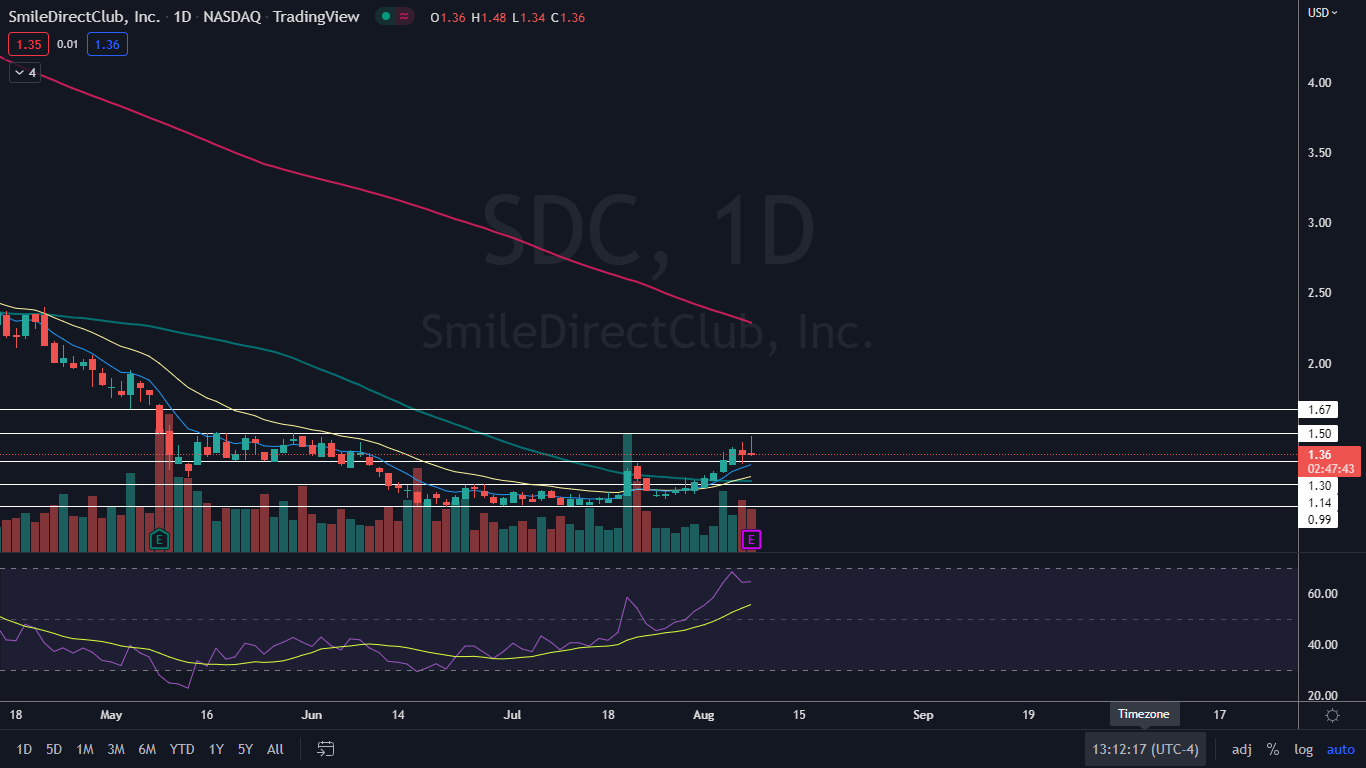
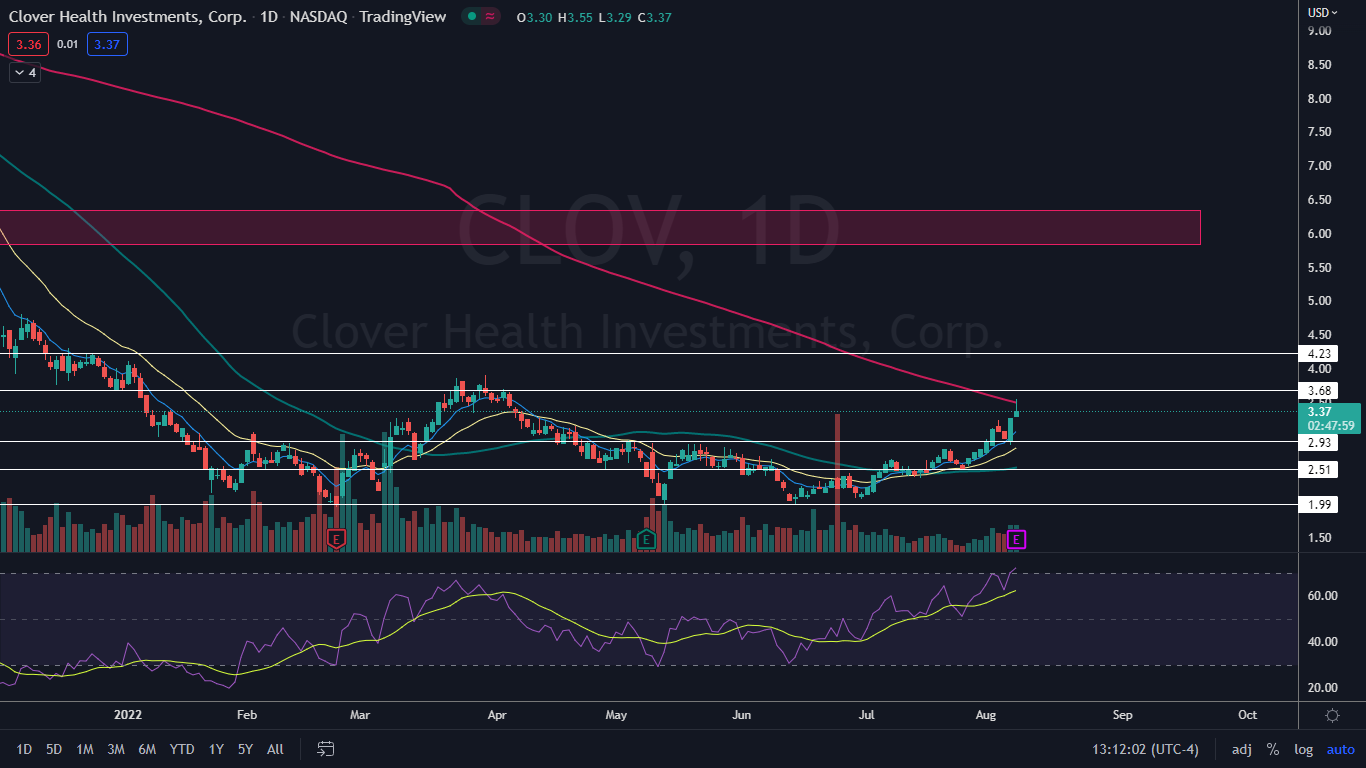
SmileDirectClub, Inc SDC and Clover Health Investments Corp CLOV, which made parabolic moves higher in January and June 2021, respectively, surged on Monday in tandem with AMC before giving back most of their daily gains intraday.
Want direct analysis? Find me in the BZ Pro lounge! Click here for a free trial.
The AMC Chart: AMC is in need of consolidation after surging about 85% between July 27 and Monday. AMC’s relative strength index (RSI) is measuring in at about 82%, and when a stock’s RSI reaches or exceeds the 70% level it becomes overbought, which can be a sell signal for technical traders.
Bullish traders want to see AMC consolidate sideways for a period of time or trade slightly lower to settle into a bull flag pattern. Sideways trading or slightly lower prices on lower-than-average volume will help to bring the stock’s RSI down to a more comfortable level.
Bullish traders would prefer to see AMC’s consolidation take place above the 200-day SMA on declining volume. Traders can then watch for a break up or down from the consolidation patterns to gauge future direction.
AMC has resistance above at $25.79 and $29.45 and support below at $20.36 and $17.07.
See Also: AMC, GameStop Are Running Again: What's Behind The Latest Meme Stock Rally?
 The SmileDirectClub Chart: SmileDirectClub surged about 10% on Monday before running into a group of sellers who pushed the stock down to trade flat. The $1.50 area has been acting as a major resistance zone for SmileDirectClub, with the stock unable to trade above the level since May 10.
SmileDirectClub is trading in an uptrend pattern on the daily chart and, as with AMC, SmileDirectClub’s RSI became overextended, which indicates a pullback, at least to print another higher low, may be in the cards. On Monday, SmileDirectClub’s RSI was hovering at around 65%.
The stock has resistance above at $1.50 and $1.67 and support below at $1.30 and $1.14.
 The Clover Health Chart: Like SmileDirectClub, Clover Health soared about 9% higher on Monday but ran into a group of sellers. The selling pressure caused Clover Health to reject the 200-day SMA, which means the stock is stuck in a bear cycle.
Like AMC and SmileDirectClub, Clover Health is trading in an uptrend and may be preparing to print its next lower high. Clover Health’s RSI is also extended to the upside, measuring in at 72%.
Clover Health has resistance above at $3.68 and $4.23 and support below at $2.93 and $2.51.
Photo via Shutterstock.
Edge Rankings
Price Trend
© 2025 Benzinga.com. Benzinga does not provide investment advice. All rights reserved.
Trade confidently with insights and alerts from analyst ratings, free reports and breaking news that affects the stocks you care about.