Zinger Key Points
- For the second quarter, analysts, on average, estimate Plug will report revenues of 164.76 million.
- Plug Power is trading in an uptrend but on Tuesday the stock gapped down below the 200-day SMA.
- The new Benzinga Rankings show you exactly how stocks stack up—scoring them across five key factors that matter most to investors. Every day, one stock rises to the top. Which one is leading today?
Plug Power, Inc PLUG was sliding over 4% lower on Tuesday as the stock headed toward its second-quarter earnings print, which is expected after the market close.
When the hydrogen fuel cell systems manufacturer printed its first-quarter earnings miss on May 9, the stock plunged 20% over the three trading days that followed to reach a May 12 52-week low of $12.70. The stock then traded sideways in consolidation, between the $14 and $20 range, until breaking up from the pattern on July 28.
For the first quarter, Plug reported revenue of $140.8 million and for the second quarter, analysts, on average, estimate Plug will report revenues of $164.76 million.
From a technical analysis perspective, Plug Power’s stock looks bullish heading into the event, having settled into a consistent uptrend pattern on the daily chart and a possible bull flag pattern. It should be noted that holding stocks or options over an earnings print is akin to gambling because stocks can react bullishly to an earnings miss and bearishly to an earnings beat.
Options traders — particularly those who are holding close dated calls or puts — take on extra risk because the algorithms writing the options increase premiums to account for implied volatility.
For options traders with weekly calls, to profit from Plug Power’s potential run higher or drop to new lows, the stock will need to move more than 10.58%, which is the implied move institutions have priced into the calls and puts expiring this Friday. If Plug reacts to a lesser degree, the premiums will drop on Wednesday and the options are likely to expire worthless.
Want direct analysis? Find me in the BZ Pro lounge! Click here for a free trial.
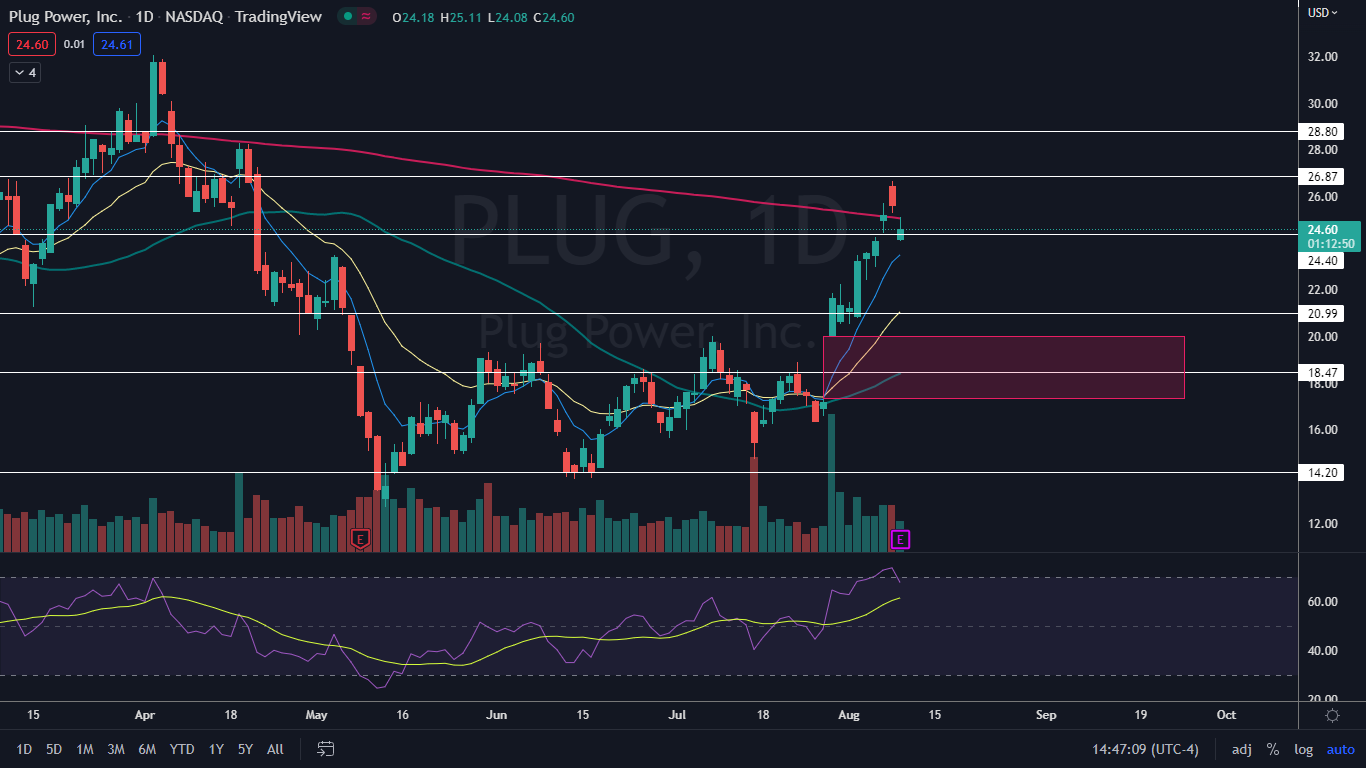
The Plug Power Chart: Plug Power has been trading in a strong and consistent uptrend since July 15, with the most recent higher low formed on Aug. 1 at $20.55 and the most recent higher high printed at the $26.65 level on Monday. If Plug Power receives a positive reaction to its earnings print, Tuesday’s low-of-day may serve as the next lower high within the pattern.
- Plug Power may also be settling into a bull flag pattern on the daily chart, with the pole formed between July 27 and Monday and the flag beginning to form on Tuesday. If bull flag becomes a dominant pattern, the measured move is about 60%, which indicates the stock could surge toward the $38 mark.
- From a bearish perspective, Plug Power gapped down below the 200-day simple moving average (SMA) on Tuesday and the area may now act as heavy resistance. The 200-day SMA is considered to be a bellwether indicator that helps to determine whether a security is trading in a bullish or bearish cycle.
- Traders should be aware that Plug Power’s relative strength index is measuring in at about 69%, putting the stock in overbought territory. If Plug Power trends higher following the earnings print, a pullback is likely to come over the next few days because consolidation is needed.
- Plug Power has resistance above at $26.87 and $28.80 and support below at $24.40 and $20.99.
 See Also: Plug Power Q2 Earnings On Deck: What To Watch For After The Bell
Photo courtesy of Plug Power.
Edge Rankings
Price Trend
© 2025 Benzinga.com. Benzinga does not provide investment advice. All rights reserved.
Trade confidently with insights and alerts from analyst ratings, free reports and breaking news that affects the stocks you care about.