


Zinger Key Points
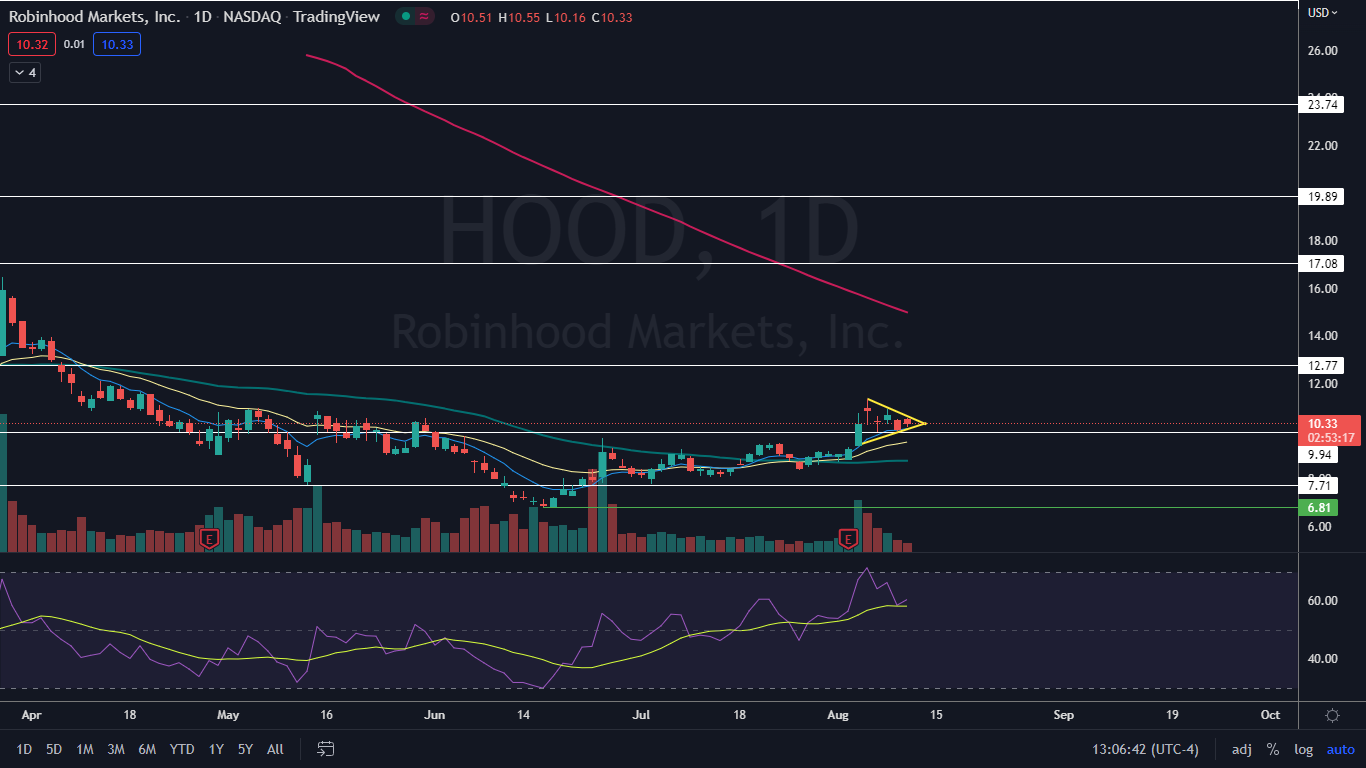
- Robinhood is trading in a symmetrical triangle, which could also be part of a bull flag pattern.
- Traders and investors can watch for a break from the pattern on higher-than-average volume.
- Feel unsure about the market’s next move? Copy trade alerts from Matt Maley—a Wall Street veteran who consistently finds profits in volatile markets. Claim your 7-day free trial now.
Robinhood Markets, Inc HOOD was trading about 2% higher on Wednesday in tandem with Coinbase Global, Inc COIN, which received a positive reaction to its second-quarter earnings miss.
The upswing in the two trading platforms' stocks was boosted by a bullish reaction in the general markets to consumer price index data that indicated inflation may be past its peak. Despite trading higher, Robinhood and Coinbase failed to break up from the symmetrical triangles that each stock has been tightening into since Aug. 4.
A symmetrical triangle pattern is created when a stock forms a series of lower highs and higher lows between a descending and an ascending trendline, which meet on the right side of the chart to form an apex. The pattern indicates that the bulls and bears are equally in control.
A symmetrical triangle is often formed on lower-than-average volume and demonstrates a decrease in volatility, indicating consolidation. The decreasing volume is often followed by a sharp increase in volume when the stock breaks up or down from the pattern, which should happen before the stock reaches the apex of the triangle.
- Aggressive bullish traders may choose to purchase a stock in a symmetrical triangle when the security reverses course on the lower ascending trendline, with a stop set if the stock rejects at the upper descending trendline of the pattern. More conservative traders may wait for the stock to break up bullishly from the pattern on higher-than-average volume.
- Aggressive bearish traders may choose to trade opposite to the bulls, entering into a short position on a rejection of the upper descending trendline and covering the position if the stock finds support at the lower trendline. Opposite to the bulls, conservative bearish traders may wait for the stock to break down from the lower trendline on higher-than-average bearish volume.
Want direct analysis? Find me in the BZ Pro lounge! Click here for a free trial.
The Robinhood Chart: Robinhood is set to meet the apex of its symmetrical triangle on Aug. 12 and traders and investor can watch for the stock to break up or down from the formation on higher-than-average volume prior to that date to gauge whether the pattern was recognized. The symmetrical triangle on Robinhood’s chart leans bullish because the stock was trading higher before forming the pattern.
The symmetrical triangle could also be the flag of a bull flag pattern, when paired with the sharp rise between Aug. 2 and Aug. 4. If the bull flag pattern is recognized, the measured move is about 30%, which suggests Robinhood could soar toward $13.
- Robinhood’s symmetrical triangle has been taking place on decreasing volume on the daily chart, which indicates a period of consolidation. The consolidation has helped to drop Robinhood’s relative strength index slightly from overbought territory, which also leans bullish for future price movement.
- On Wednesday, Robinhood looked likely to print a doji candlestick on the daily chart, which suggests indecision. The stock may need to trade sideways further into the apex of the triangle before breaking up or down from the area.
- Robinhood has resistance above at $12.77 and $17.08 and support below at $9.94 and $7.71.
See Also: FTX CEO Sam Bankman-Fried Estimates Coinbase (COIN) Is Losing $3B Per Year
Edge Rankings
Price Trend
© 2025 Benzinga.com. Benzinga does not provide investment advice. All rights reserved.
Trade confidently with insights and alerts from analyst ratings, free reports and breaking news that affects the stocks you care about.

