
Zinger Key Points
- Stock's rarely fly up through or drop down below the 200-day SMA on the first attempt.
- The 200-day SMA is a massive level, which indicates whether a stock is trading in a bear or bull cycle.
- Get real-time earnings alerts before the market moves and access expert analysis that uncovers hidden opportunities in the post-earnings chaos.
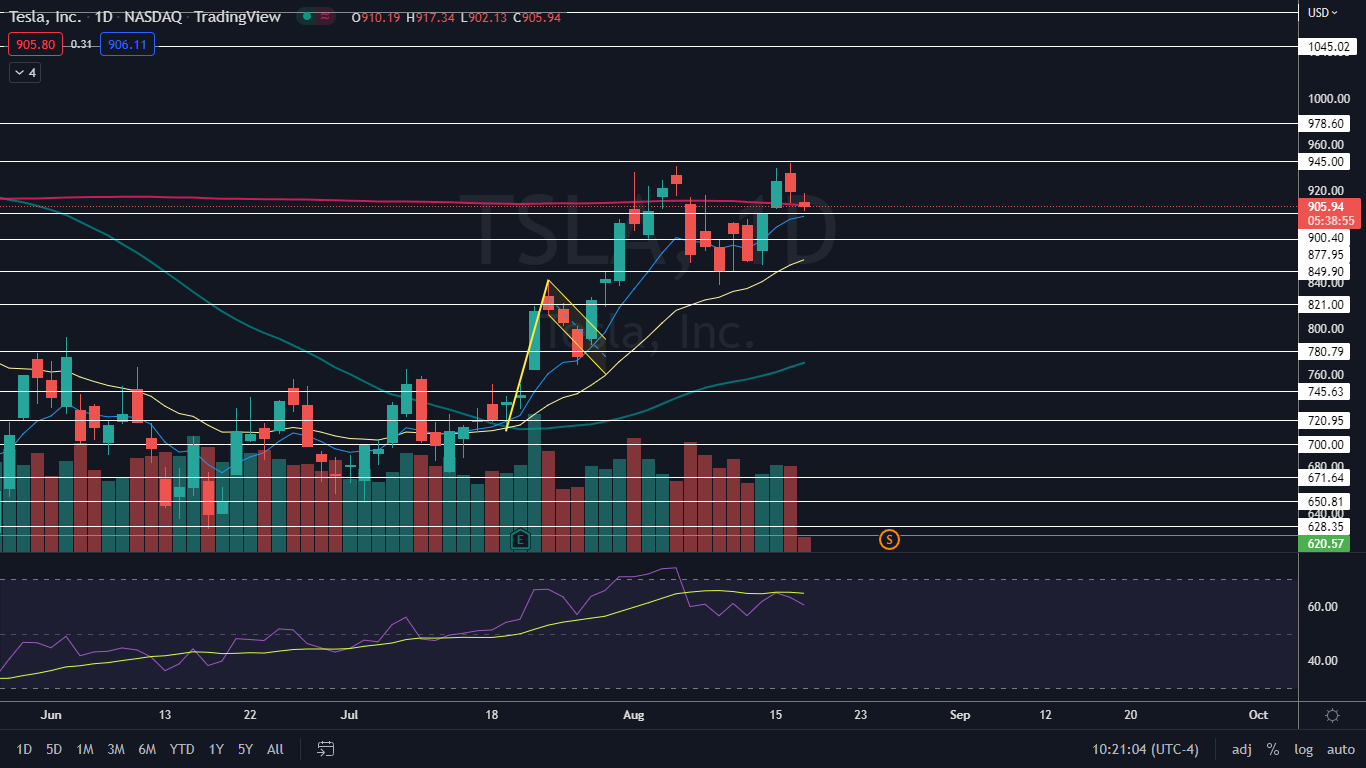
Tesla Inc TSLA appeared to be consolidating on Wednesday, trading slightly lower to test support at the 200-day simple moving average (SMA).
On Aug. 25, Tesla will begin trading on a 3-1 split-adjusted basis, meaning that if the stock closes the Aug. 24 trading session near the $900 mark, shares of the EV-giant will begin trading at about $300 the following day.
After announcing the split on Aug. 4, Tesla declined 7.7% between Aug. 5 and the low-of-day on Aug. 9 before beginning to rebound.
As of Wednesday, Tesla is trading about 1.7% below the closing price on Aug. 4.
A precedent was set in 2020 when Tesla announced its last stock split, with it having surged 81.29% higher between Aug. 11 and Aug. 31 of that year.
There is an expectation the stock would react similarly this time. So far, that hasn’t been the case, likely because of the stock’s proximity to the 200-day SMA, which is a massive level that acts as heavy resistance and solid support.
The 200-day SMA is an important bellwether. Technical traders and investors consider a stock trading above the level on the daily chart to be in a bull cycle, whereas a stock trading under the 200-day SMA is considered to be in a bear cycle.
The 50-day SMA also plays an important role in technical analysis, especially when paired with the 200-day. When the 50-day SMA crosses below the 200-day SMA, a death cross occurs whereas when the 50-day SMA crosses above the 200-day, a bullish golden cross takes place.
Want direct analysis? Find me in the BZ Pro lounge! Click here for a free trial.
The Tesla Chart: It is very rare for a stock or broad market ETF to run up through or drop down below the 200-day SMA on the first or even second try. If a stock is attempting to move up through the 200-day, as Tesla has been, it’s likely to hover near the indicator for a period of time before deciding whether the area will become true support or resistance for the longer-term future.
- Tesla is trading in an uptrend, with the most recent higher low printed on Aug. 12 at $855.10 and the most recent confirmed higher high formed at the $944 mark on Tuesday. On Wednesday, Tesla was trading lower, possibly to print its next higher low within the pattern. Unfortunately, the formation of the higher low may take place under the 200-day SMA, which will bring indecision to bullish traders.
- Ideally, bullish traders want to see Tesla hold above the eight-day exponential moving average (EMA) on the daily chart and eventually form a reversal candlestick, such as a doji or hammer candlestick above the area. If Tesla can reverse upwards above the eight-day EMA, the stock may form a bull flag pattern under the 200-day SMA, which could help Tesla regain the bellwether indicator as support.
- Tesla has resistance above at $945 and $978.60 and support below at $900.40 and $877.95.
 See Also: China's EVE To Provide BMW With Tesla-Like Cylindrical Batteries: Reuters
Photo: Tesla Model X, courtesy Tesla Inc.
© 2025 Benzinga.com. Benzinga does not provide investment advice. All rights reserved.
Trade confidently with insights and alerts from analyst ratings, free reports and breaking news that affects the stocks you care about.

