Zinger Key Points
- Apple is trading in a confirmed uptrend, making a consistent series of higher highs and higher lows.
- The stock is also trading in a bullish inside bar but may require the SPY to cooperate in order to move higher.
- Get access to your new suite of high-powered trading tools, including real-time stock ratings, insider trades, and government trading signals.
Apple, Inc AAPL was trading flat on Thursday in consolidation. The market leader has been on an impressive run recently, surging 34% since June 17 and over 8% this month alone.
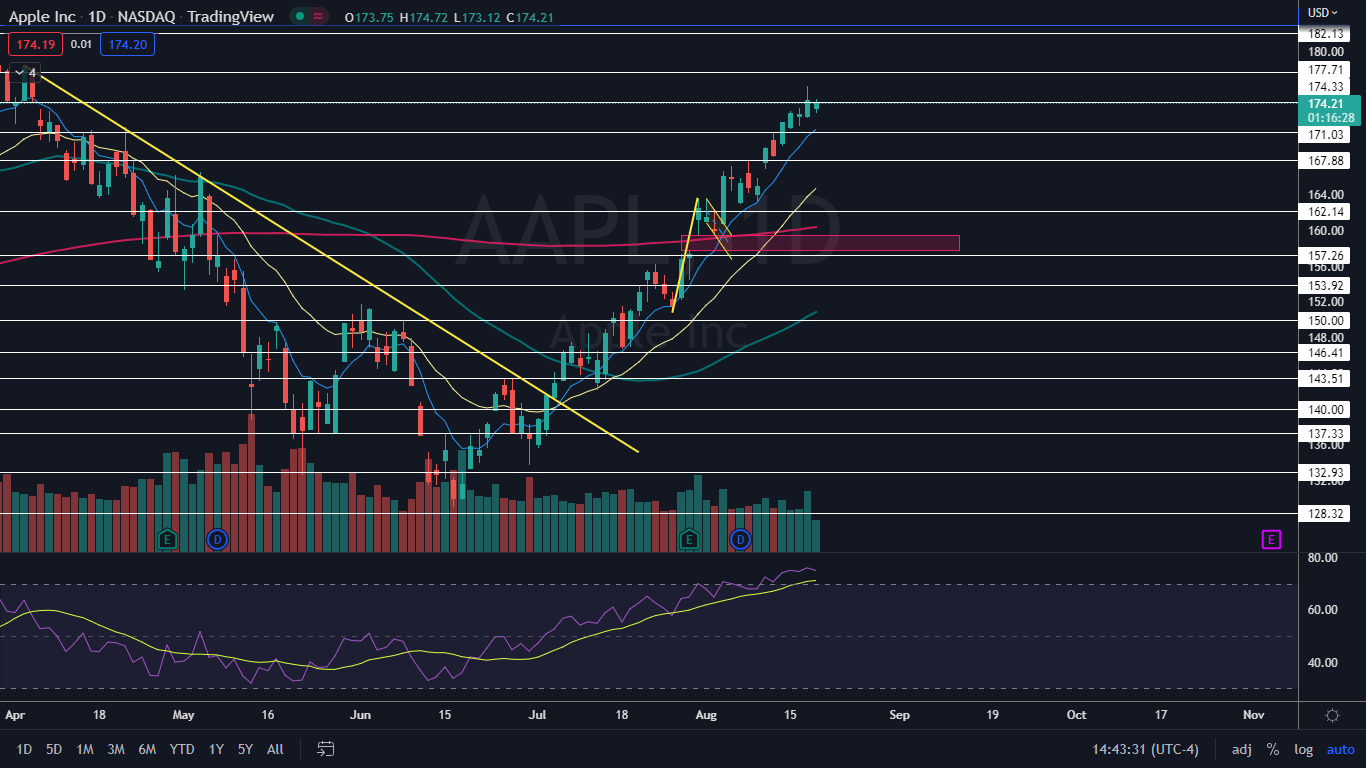
The stock has printed a higher low in its uptrend since Aug. 9, which likely causes bullish traders to feel cautious that a retracement to the downside is on the horizon. On Thursday, while not printing a higher low, Apple was trading in an inside bar pattern on the daily chart.
An inside bar pattern indicates a period of consolidation and is usually followed by a continuation move in the direction of the trend.
An inside bar pattern has more validity on larger time frames (four-hour chart or larger). The pattern has a minimum of two candlesticks and consists of a mother bar (the first candlestick in the pattern) followed by one or more subsequent candles. The subsequent candle(s) must be completely inside the range of the mother bar and each is called an "inside bar."
A double or triple inside bar can be more powerful than a single inside bar. After the break of an inside bar pattern, traders want to watch for high volume for confirmation the pattern was recognized.
- Bullish traders will want to search for inside bar patterns on stocks that are in an uptrend. Some traders may take a position during the inside bar prior to the break, while other aggressive traders will take a position after the break of the pattern.
- For bearish traders, finding an inside bar pattern on a stock that's in a downtrend will be key. Like bullish traders, bears have two options of where to take a position to play the break of the pattern. For bearish traders, the pattern is invalidated if the stock rises above the highest range of the mother candle.
Want direct analysis? Find me in the BZ Pro lounge! Click here for a free trial.
The Apple Chart: Apple’s most recent low within its uptrend was printed on Aug. 9 at $163.25 and the most recent higher high was formed at the $176.15 mark on Wednesday. On Thursday, Apple was consolidating the sharp surge higher by printing an inside bar pattern, with all of the day’s trading range taking place within Thursday’s mother bar.
- The inside bar leans bullish in this case because Apple was trading higher before printing the pattern. The stock was also trading on lower-than-average volume, which coincides with the theory that the inside bar is valid. At the time of writing, about 39.3 million shares of Apple had exchanged hands compared to the 10-day average of 62.06 million.
- Consolidation on Apple is needed because the stock’s relative strength index (RSI) has been measuring in above 70% since Aug. 9. When a stock’s RSI reaches or exceeds that level it becomes overbought, which can be a sell signal for technical traders.
- It’s noteworthy that Apple regained the 200-day simple moving average (SMA) on July 29, but the SPDR S&P 500 SPY has so far failed to trade up above the same level.
- If the SPY is eventually able to regain the 200-day SMA as support, Apple could make a run back for all-time highs. If the SPY continues to reject the 200-day, Apple is likely to follow and trade lower over the coming days.
- Apple has resistance above at $174.33 and $177.71 and support below at $171.03 and $167.88.
 See Also: Browsers Have Become Google, Apple's Achilles' Heel In Antitrust Fight: Report
Photo via Shutterstock.
© 2025 Benzinga.com. Benzinga does not provide investment advice. All rights reserved.
Trade confidently with insights and alerts from analyst ratings, free reports and breaking news that affects the stocks you care about.