Zinger Key Points
- Thursday and Friday's price action confirmed the SPY is trading in a downtrend.
- Bullish traders and investors will be waiting anxiously for positive CPI data on Sept. 13.
- Get access to your new suite of high-powered trading tools, including real-time stock ratings, insider trades, and government trading signals.
The SPDR S&P 500 SPY took a nose dive beginning at 10 a.m. Friday when Federal Reserve chair Jerome Powell began to speak at the annual Jackson Hole Economic Symposium in Wyoming.
The stock market’s bearish reaction was due to both Powell’s overall hawkish tone as well as his comments, which while direct, provided no specific details of how high the Fed will hike rates again in September.
“Our decision at the September meeting will depend on the totality of incoming data and the evolving outlook,” Powell said.
The market is forward-looking and on Aug. 10, when the Labor Department released inflation data for July showing an 8.5% year-over-year increase in the consumer price index, the market surged higher, pricing in a belief that inflation had peaked. Slowing inflation led many to believe the Fed may begin to loosen its policy.
Powell’s comments indicate that may not be the case.
“While the latest economic data has been mixed, in my view, our economy continues to show strong underlying momentum,” said Powell, leaving open the possibility the Fed may hike rates by another 0.75% in September.
Speaking about the back-to-back 0.75% increases, which the Fed raised rates by in June and July, Powell said, “another unusually large increase could be appropriate at our next meeting.”
A small glimmer of hope was offered when Powell said, “at some point, as the stance of monetary policy tightens further, it likely will become appropriate to slow the pace of increases.” The comment left no certainty as to when the easing of rate hikes may come.
The market may need some time to digest Powell’s speech and is likely to trade in a choppy manner over the next days and weeks. Relief may come on Sept. 13 when CPI data for the month of August is released at 8:30 a.m., one week before the Fed meets to make its decision on the next rate hike.
Want direct analysis? Find me in the BZ Pro lounge! Click here for a free trial.
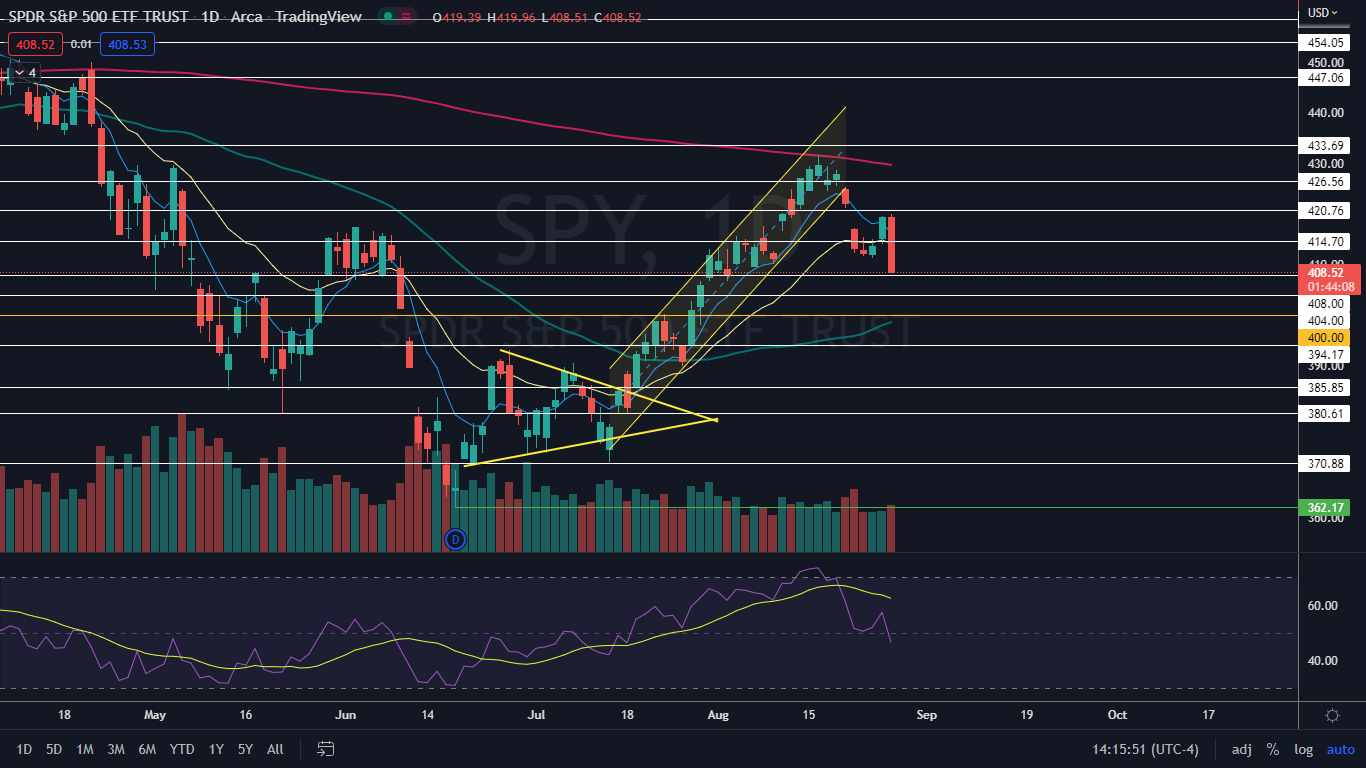
The SPY Chart: The sharp 2.5% plunge on Friday caused the SPY to print a bearish engulfing candlestick on the daily chart. The candlestick indicates lower prices, and possibly even a gap down, could be the case for Monday.
- Eventually, a bounce to the upside is likely to come because when a stock or ETF moves in one direction too quickly, sideways consolidation is likely to take place. The second most likely scenario to lower prices on Monday is that the SPY forms an inside bar, which will lean bearish because the ETF was trading lower before forming the pattern.
- Thursday’s high-of-day combined with Friday’s steep decline has confirmed the SPY is now trading in a downtrend. The most recent lower high was formed on Thursday and Friday at $419 and the most recent confirmed lower low was printed at the $411.39 mark on Wednesday.
- Bullish traders may want to exercise patience until a sign of a reversal to the upside is printed, such as a bullish doji or hammer candlestick. Bearish traders may be working to manage their greed, knowing that an eventual bounce to the upside will come.
- The SPY has resistance above at $414.70 and $420.76 and support below at $408, $404 and the important $400 psychological level.
 See Also: 'Set Your Clock To It': 2022's Reliable Signal For When To Sell Stocks
© 2025 Benzinga.com. Benzinga does not provide investment advice. All rights reserved.
Trade confidently with insights and alerts from analyst ratings, free reports and breaking news that affects the stocks you care about.