


Zinger Key Points
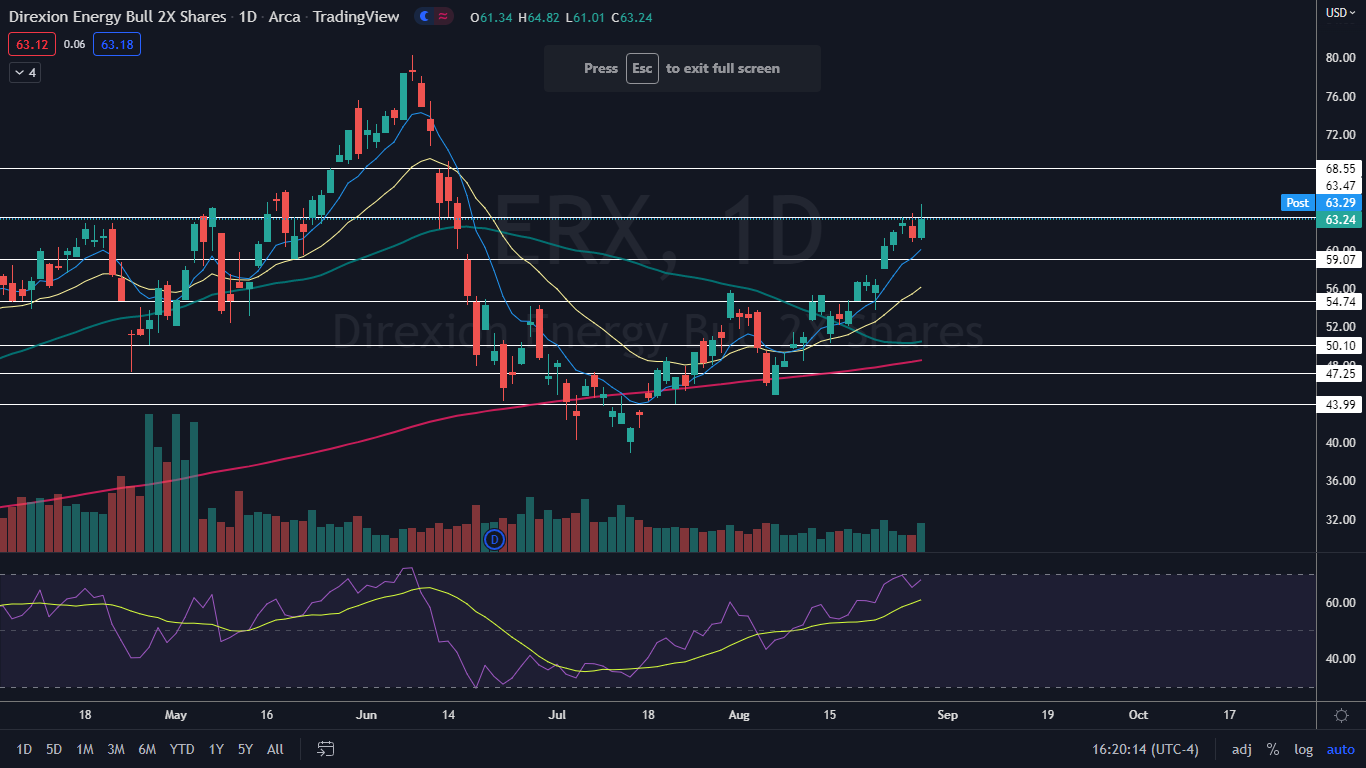
- ERX is trading in a fairly consistent uptrend, making a series of higher highs and higher lows.
- Concern over global oil supplies heading into winter could cause a longer-term bull cycle in energy names.
- Get real-time earnings alerts before the market moves and access expert analysis that uncovers hidden opportunities in the post-earnings chaos.
Direxion Energy Bull 2X Shares ERX closed up more than 3% higher on Monday as the ETF continued to trend within its uptrend.
The energy sector had been enjoying another bull cycle, which began on July 14. The surge higher on Monday may have been ignited after news of increasing unrest in Iraq, OPEC’s second-largest oil producer.
Clashes in the middle-eastern country erupted Monday after Shiite Muslim cleric Muqtada al-Sadr announced his resignation from politics. In response, his supporters stormed the government palace in Baghdad and gunfire broke out on the streets, leaving four dead and many wounded.
Following Russia’s invasion of Ukraine in February, concern has grown over global oil supplies, especially heading into winter, when the commodity will become increasingly needed for heat.
The ETF: ERX is a double leveraged fund that is designed to outperform companies held in the S&P Energy Select Sector Index by 200%. The index includes a variety of energy-related stocks, with two giants, Exxon Mobil Corp XOM and Chevron Corporation CVX, making up 43.78% of its weighted holdings.
A few other top 10 names in the ETF include EOG Resources Inc EOG, weighted at 4.78%, ConocoPhillips COP, weighted at 4.56% and Schlumberger NV SLB, which is weighted at 4.39% within the ETF.
It should be noted that leveraged ETFs are meant to be used as a trading vehicle as opposed to long-term investments.
Want direct analysis? Find me in the BZ Pro lounge! Click here for a free trial.
The ERX Chart: ERX reversed course on July 14 and has since made a fairly consistent series of higher highs and higher lows. The most recent higher low was formed on Aug. 22 at $53.78 and the most recent confirmed higher high was printed at the $57.37 mark the day prior.
- On Monday, ERX formed a candlestick with a long upper wick, which may suggest the next higher high is in and the ETF will trade lower on Tuesday. The second most likely scenario is that ERX begins to consolidate in a sideways trading pattern on decreasing volume, to gain power for another run higher.
- ERX is trading above the eight-day and 21-day exponential moving averages (EMAs), with the eight-day EMA trending above the 21-day, both of which are bullish indicators. The ETF is also trading above the 50-day and 21-day simple moving averages, which indicates longer-term sentiment is bullish.
- If ERX trades higher again over the next few days, a pullback may be on the horizon because the ETF’s relative strength index (RSI) is measuring in at about 68%. When a stock or ETF’s RSI nears or reaches the 70% level it becomes overbought, which can be a sell signal for technical traders.
- ERX has resistance above at $63.47 and $68.55 and support below at $59.07 and $54.74.
 See Also: Alphabet And These 3 Energy Plays Are CNBC's Final Trades
Photo: Mark Geistweite via Shutterstock
© 2025 Benzinga.com. Benzinga does not provide investment advice. All rights reserved.
Trade confidently with insights and alerts from analyst ratings, free reports and breaking news that affects the stocks you care about.

