Zinger Key Points
- Amazon, Microsoft and Nike are all bouncing higher but trading within a downtrend.
- For the stocks to negate their downtrends, either a higher high or a higher low will need to print.
- Don't face extreme market conditions unprepared. Get the professional edge with Benzinga Pro's exclusive alerts, news advantage, and volatility tools at 60% off today.
Amazon.com, Inc AMZN, Microsoft Corporation MSFT and Nike, Inc NKE were all trading slightly higher on Friday after printing bullish reversal candlesticks on Thursday, which suggested a bounce was likely to come.
A hammer candlestick pattern forms when a red or green candlestick prints, with a long lower wick and a short upper body, which resembles a hammer.
A hammer candlestick, when found in a downtrend, can indicate a reversal to the upside is on the horizon. It is a lagging indicator, as the next candle on the time frame being studied must print before the pattern can be validated.
A hammer candlestick doesn’t necessarily mean a new uptrend will occur, only that a bounce higher is likely imminent.
Candlestick patterns can be used to indicate the future price direction of a stock. Candlestick patterns are especially useful for technical traders when they are combined with other indicators such as larger patterns, trading volume, relative strength index (RSI) and divergences between RSI and price action.
Want direct analysis? Find me in the BZ Pro lounge! Click here for a free trial.
The Amazon Chart: On Thursday, Amazon printed a hammer candlestick near the lower range of the gap, which Benzinga called out was likely to happen on Monday. On Friday, Amazon bounced up higher to confirm the hammer candlestick was recognized.
- Amazon has been trading in a downtrend since Aug, 16 making a consistent series of lower highs and lower lows. Amazon’s most recent lower high within the downtrend was formed on Aug. 26 $137.83 and the most recent lower low was printed at the low-of-day on Thursday.
- For Amazon to negate the downtrend, the stock will need to either soar up above $138 or retrace to print a higher low above $124.
- Amazon has resistance above at $131 and $136.83 and support below at $125.93 and $122.24.
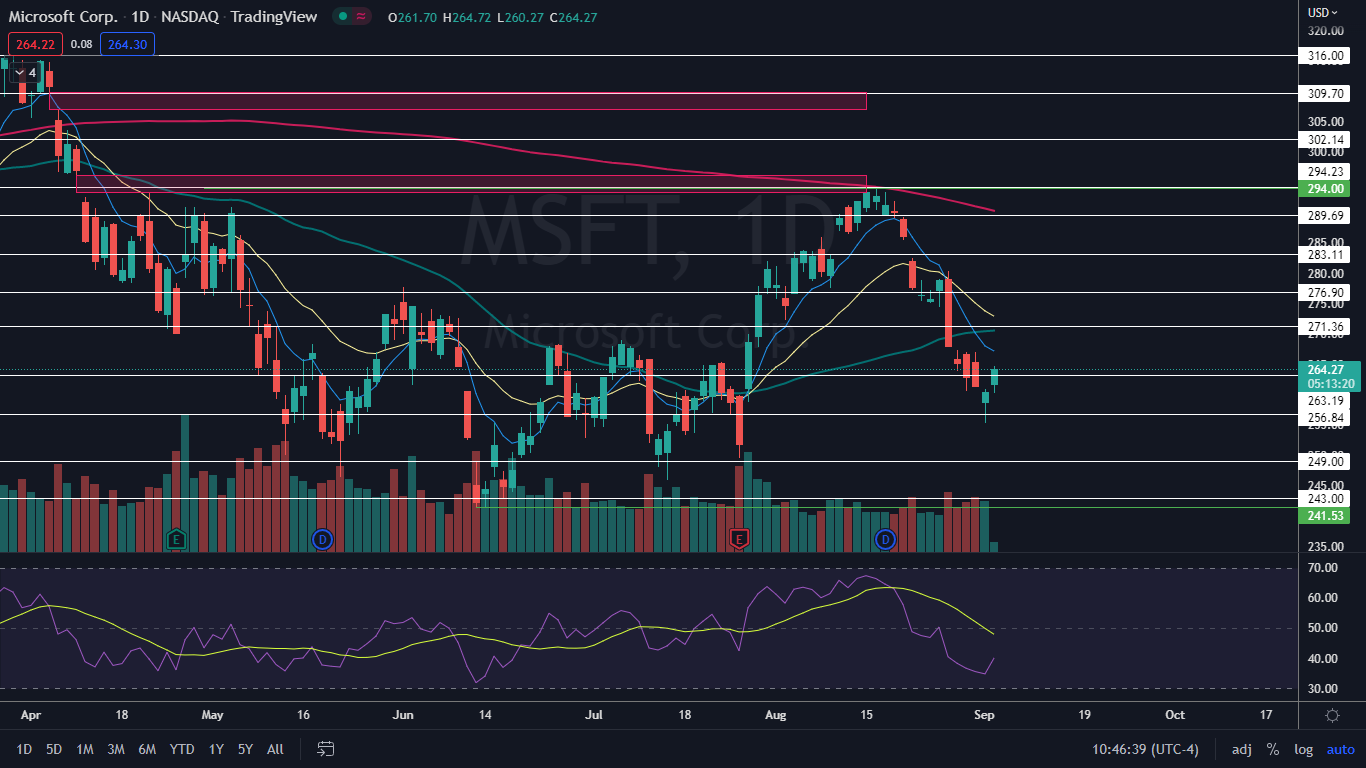
 The Microsoft Chart: Like Amazon, Microsoft’s hammer candlestick was confirmed on Friday with higher prices. The stock is also trading in a downtrend, with the most recent lower high formed on Wednesday at $267.11 and the most recent lower low formed at the $255.41 mark on Thursday.
- Also like Amazon, Microsoft can negate the downtrend by spiking up above $268 or by printing a high low above Thursday’s low-of-day on the next retracement. If Microsoft is able to rise up to print a higher high, the stock will gain the eight-day exponential moving average (EMA), which would be bullish.
- Microsoft has resistance above at $271.36 and $276.90 and support below at $263.19 and $256.84.
 The Nike Chart: Nike has also been in a downtrend since Aug. 16, making a series of lower highs and lower lows. Nike’s most recent lower high was formed on Tuesday at $110.08 and the most recent lower low was printed at the $103.80 mark in Thursday.
- Nike was showing less strength on Friday compared to Amazon and Microsoft, but was still working to print a dragonfly candlestick, which could indicate higher prices will come again on Monday. In order to print a higher high, Nike will have to regain the eight-day EMA first, which makes a continuation of the downtrend even more likely.
- Nike has resistance above at $109.90 and $115.59 and support below at $103.46 and $99.53.
 See Also: (TRSSF) – This Marijuana Stock Has Outperformed Amazon, Google, Facebook And Netflix
Edge Rankings
Price Trend
© 2025 Benzinga.com. Benzinga does not provide investment advice. All rights reserved.
Trade confidently with insights and alerts from analyst ratings, free reports and breaking news that affects the stocks you care about.