Zinger Key Points
- AMD and Nvidia are both trading in confirmed downtrends, making lower highs and lower lows.
- The stock's candlesticks on Thursday indicated a bounce was likely to come.
- Don't face extreme market conditions unprepared. Get the professional edge with Benzinga Pro's exclusive alerts, news advantage, and volatility tools at 60% off today.
Advanced Micro Devices, Inc AMD and Nvidia Corporation NVDA were each trading over 1% lower on Friday after a bearish day on Thursday dropped the stocks 3% and almost 5%, respectively, off Wednesday’s close.
On Wednesday evening, Nvidia announced that it received information from the U.S. government stating that in order to export its AI processors to China, it would need to first secure a license. AMD revealed through a spokesperson that it received the same communication.
Nvidia said it was in discussions with the government on how to secure exemptions, and on Friday the government looked to be relaxing some of its restrictions.
Friday’s news helped to prop AMD and Nvidia up temporarily, but when the S&P 500 index rejected the $4,000 level, the market took a bearish turn, bringing both chipmakers down with it.
Want direct analysis? Find me in the BZ Pro lounge! Click here for a free trial.
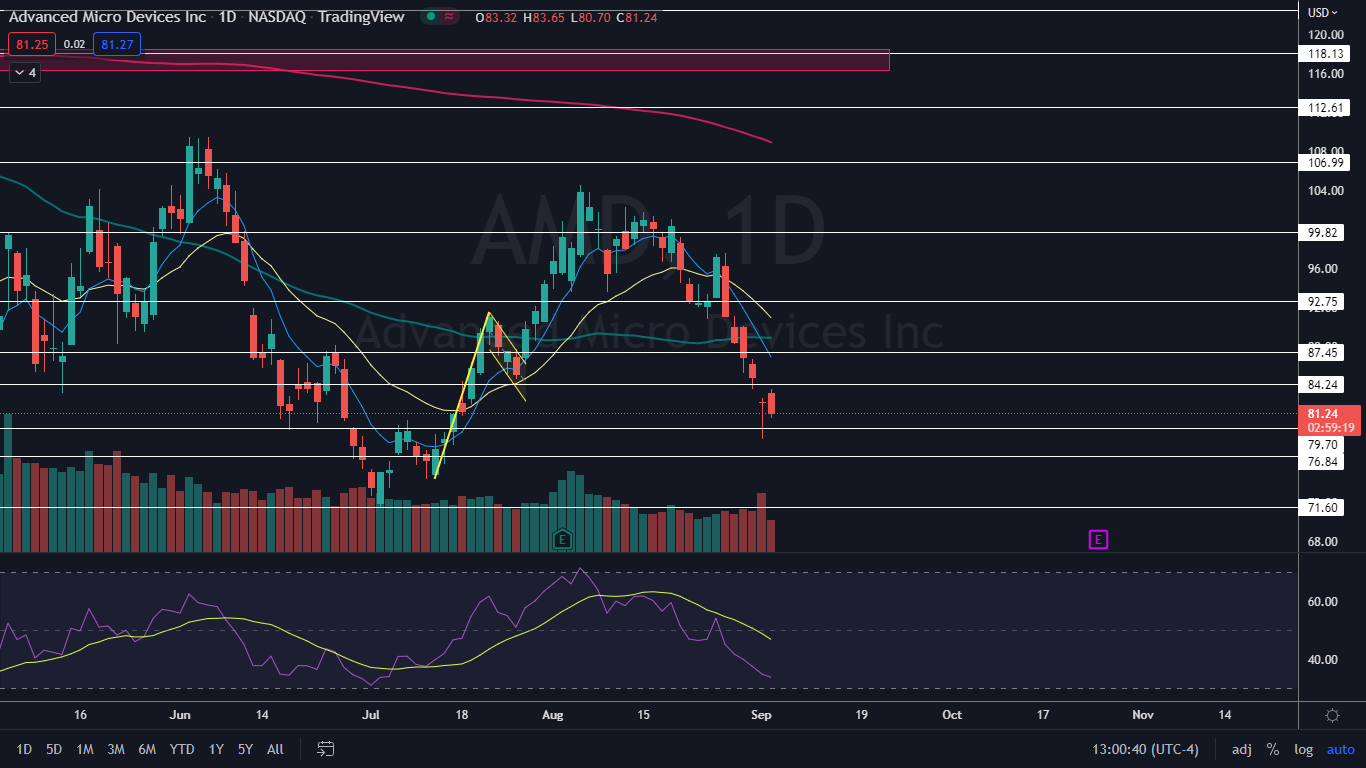
The Advanced Micro Devices Chart: AMD began trading in a downtrend on Aug. 4 and has since made a very consistent series of lower highs and lower lows. AMD’s most recent lower high was printed on Aug. 26 at $97.60 and the most recent lower low was formed at the $78.52 mark on Thursday.
- AMD printed a bullish dragonfly candlestick on Thursday, which indicated the stock was likely to bounce Friday. AMD was able to break up over Thursday’s high-of-day from an initial inside bar pattern, which may have created the next lower high within the downtrend.
- If AMD closes the trading day near its low-of-day price, the stock will print a bearish Marubozu candlestick, which could indicate lower prices will come again on Monday. If the stock is able to rise up to close the session flat or at a high-of-day price, AMD will print a dragonfly or hammer candlestick, respectively, which could indicate a further bounce to the upside is on the horizon.
- AMD has resistance above at $84.24 and $87.45 and support below at $79.70 and $76.84.
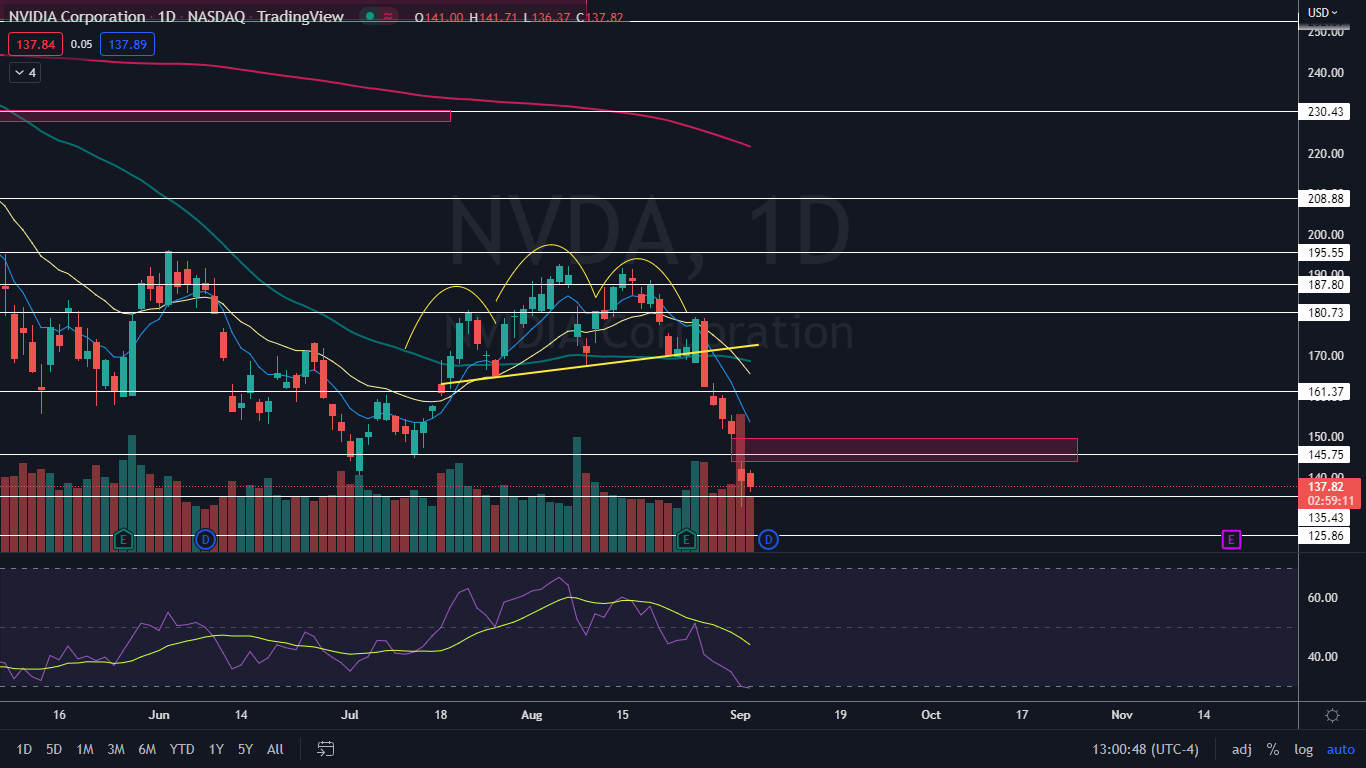
 The Nvidia Chart: Compared to AMD, Nvidia showed weakness on Friday because although the stock printed a bullish hammer candlestick on Thursday, Nvidia was unable to break up from the inside bar pattern it was forming. The inside bar leans bearish in this case because Nvidia was trading lower before forming the pattern.
- Nvidia is also trading in a downtrend, with the most recent lower high formed on Aug. 25 at $179.47 and the most recent lower low printed at the $132.79 mark on Thursday. Nvidia may need to trade sideways for a period of time before bouncing up, but the bounce will eventually come because Nvidia’s relative strength index is measuring in at about 29%, putting the stock in oversold territory.
- Nvidia has resistance above at $145.75 and $161.37 and support below at $135.43 and $125.86.
Edge Rankings
Price Trend
© 2025 Benzinga.com. Benzinga does not provide investment advice. All rights reserved.
Trade confidently with insights and alerts from analyst ratings, free reports and breaking news that affects the stocks you care about.
 See Also: