Zinger Key Points
- The SPY soared 5% without printing a higher low to confirm an uptrend, which indicated a pullback was likely to come.
- The market ETF may trade sideways to consolidate the sharp decline until the Fed's monthly minutes are released next Wednesday.
- China’s new tariffs just reignited the same market patterns that led to triple- and quadruple-digit wins for Matt Maley. Get the next trade alert free.
The SPDR S&P 500 SPY gapped down and plunged over 3% on Tuesday after consumer price index (CPI) data released by the U.S. Labor Department indicated that although inflation likely peaked in July, inflation continues to run above analyst estimates.
The data sparked fears the central bank will raise interest rates by 0.75% when it meets over two days on Sept. 20 and Sept 21. The market will find out the Federal Reserve’s decision at 2:00 p.m. on the second day, when the monthly minutes are released, which will be followed by Fed chairman Jerome Powell’s press conference at 2:30 p.m.
After the central bank raised rates by 0.75% in both June and July, traders and investors had hoped inflation would drop low enough for the Fed to begin to relax its hawkish stance. Powell’s speech at the Jackson Hole Symposium last month indicated another 0.75% hike was still on the table, however.
For the month of August, CPI reached 8.3%, down from 8.5% in July. Economists estimated CPI would come in at 8%.
The Fed is walking a tight rope, trying to bring down inflation without throwing the economy into a recession.
While Tuesday’s decline was sharp, technical traders knew a pullback was on the horizon because the S&P 500 soared over 5% between Sept. 7 and Sept. 12 without retracing to form a higher low on the daily chart.
Want direct analysis? Find me in the BZ Pro lounge! Click here for a free trial.
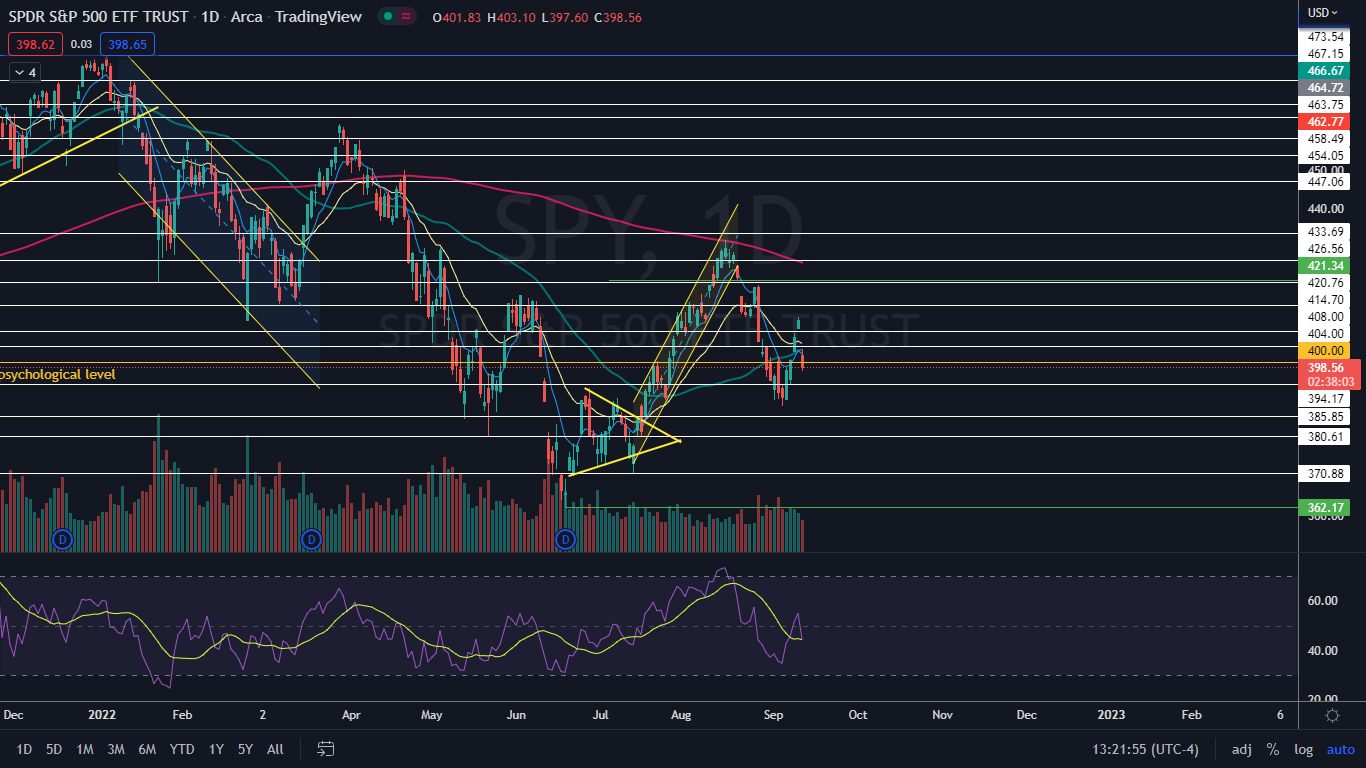
The SPY Chart: Although the drop on Tuesday was needed if a new uptrend will eventually occur, the plunge took the SPY under the psychologically important $400 level, which may now act as heavy resistance. Bullish traders and investors will want to see the ETF regain that level as support in short order for more confidence going forward.
- If the SPY closes the trading day near its low-of-day, the ETF will print a bearish kicker candlestick, which could indicate lower prices will come again on Wednesday. If that happens, bullish traders will want to see the SPY eventually print a bullish reversal candlestick, such as a doji or hammer candlestick, above the Sept. 6 low of $388.42.
- If the ETF bounces up to form a lower wick on Tuesday, the SPY will print a hammer candlestick, which could indicate a higher low has printed, and the SPY will trade higher on Wednesday. Another likely scenario is that the SPY will trade sideways in consolidation until next Wednesday's Fed minutes are released, which could then spark increased volatility.
- The SPY has resistance above $400 at $404 and $408 and support below at $394.17 and $385.85.

Edge Rankings
Price Trend
© 2025 Benzinga.com. Benzinga does not provide investment advice. All rights reserved.
Trade confidently with insights and alerts from analyst ratings, free reports and breaking news that affects the stocks you care about.