
Zinger Key Points
- Tesla is showing comparative strength to the S&P 500 due to trading above the 200-day SMA.
- When Tesla retraces to form its next higher low, traders will want to see a reversal candlestick print above the 200-day.
- Next: Access Our New, Shockingly Simple 'Alert System'
Tesla, Inc TSLA has been trading in opposition to the general market recently, showing comparative strength to other big-tech stocks and the S&P 500.
Over the past three trading days, Tesla has rallied almost 4% while the S&P 500 has declined 2.91%.
The comparative strength could be in reaction to the 200-day simple moving average, which Tesla is trading on top of, while the S&P 500 trades under the indicator.
The 200-day SMA is an important bellwether. Technical traders and investors consider a stock trading above the level on the daily chart to be in a bull cycle, whereas a stock trading under the 200-day SMA is considered to be in a bear cycle.
The 50-day SMA also plays an important role in technical analysis, especially when paired with the 200-day. When the 50-day SMA crosses below the 200-day SMA, a death cross occurs whereas when the 50-day SMA crosses above the 200-day, a bullish golden cross takes place.
A death cross occurred on Tesla’s chart on May 27, which dropped the stock into a long-term bear cycle. By June 15, Tesla was trading as much as 28% below the 200-day, making the stock extend to the downside.
Over the course of July and August, Tesla has bounced back considerably and tested the 200-day SMA as resistance multiple times. The stock has been hovering near the level since July 29, trading slightly above the 200-day and slightly below it.
On Sept. 9, Tesla regained the 200-day SMA and traders and investors will be watching to see if the stock can hold above the level on the next retracement to the downside in order to continue trading in the recent bull cycle.
Want direct analysis? Find me in the BZ Pro lounge! Click here for a free trial.
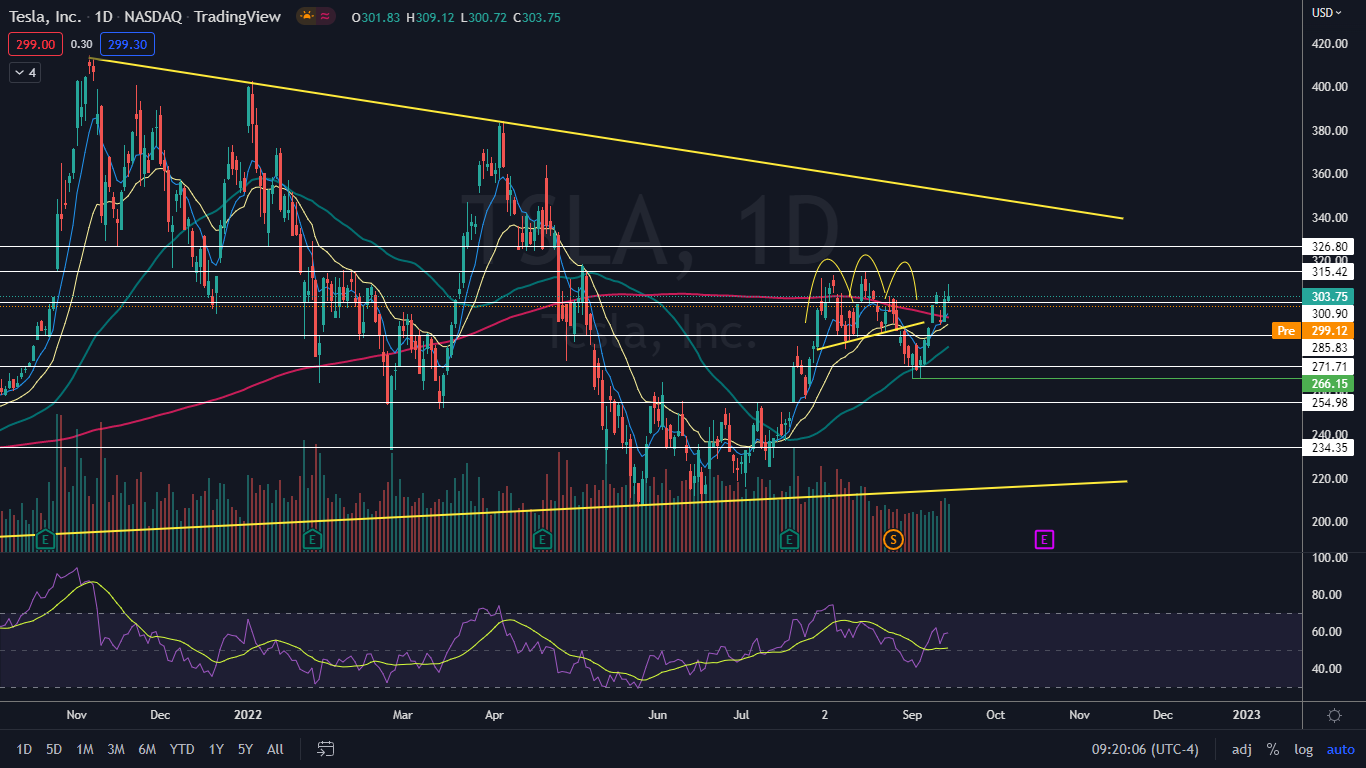
The Tesla Chart: On Sept. 1 and Sept. 6, Tesla printed a double bottom pattern at the $266 level and on Sept. 7 the pattern was recognized, which set the stock soaring into an uptrend. The most recent confirmed higher high within the trend was printed on Sept. 12 at $305.49 and the most recent higher low was formed at the $290.40 level the following day.
- If Tesla falls lower on Friday, the high-of-day on Thursday may act as the next higher high within the pattern. If the stock retraces to print its next higher low over the coming trading days, bullish traders will want to see a reversal candlestick print above the 200-day SMA.
- The 50-day SMA is trending upwards, which is a good sign for the bulls. If Tesla is able to remain above the 200-day SMA, the 50-day will eventually cross above the 200-day, which will cause a golden cross to form on Tesla’s chart.
- Tesla is also trading within a long-term triangle pattern. If Tesla continues in its uptrend, the stock may find resistance at the upper descending trendline of the pattern, which could provide a solid opportunity for bearish traders to take a position.
- Tesla has resistance above at $315.42 and $326.80 and support below at $300.90 and $285.83.
 See Also: Is Tesla The New Apple? Fund Manager Says Elon Musk's Company Will Be 'Much, Much Bigger'
© 2025 Benzinga.com. Benzinga does not provide investment advice. All rights reserved.
Trade confidently with insights and alerts from analyst ratings, free reports and breaking news that affects the stocks you care about.

