
Zinger Key Points
- Gold has been trading in a long-term downtrend within a falling channel pattern.
- Hedge funder John Paulson says bearish action is due to a belief that over the long-term, inflation will come down.
- Find out which stock just claimed the top spot in the new Benzinga Rankings. Updated daily— discover the market’s highest-rated stocks now.
Spot Gold was trading flat on Monday after some early morning volatility saw the commodity reach a new 52-week low before bouncing up.
This and other indicators show how gold isn’t a good hedge against the general markets, which have been negatively impacted by soaring inflation. The commodity has been in a long-term downtrend since March 8, declining about 20% from the high of $2,070.42/oz to trade at about $1,644/oz.
Although gold is down less than the S&P 500 year-to-date, the commodity has declined about the same amount as the S&P 500 off the all-time highs, the latter which is down 23% from the Jan. 4 all-time high of 4,818.62.
How Gold Becomes Responsive
Hudge fund founder and billionaire John Paulson believes gold is experiencing a bear cycle in the current economic environment because the market isn’t convinced inflation will be long-lasting.
“The issue is gold’s a hedge against inflation, but while the current inflation rate is high, long-term inflation expectations are still very low. It’s like 2.5%.,” the Paulson & Co. founder told Bloomberg.
Paulson sees gold beginning to trend higher if the Federal Reserve is unable to tackle inflation and, in turn, the economy weakens.
“I think what needs to happen for gold to become more responsive is if the Fed ultimately raises rates, the economy weakens, and they pause. And then they see they can’t control inflation,” Paulson said.
He added that if the Fed’s planned hikes are only able to hamper inflation down to between 4% to 6%, expectations of long-term inflation will rise.
People will not believe the Fed can control it. And then I think gold rises to higher levels,” he said.
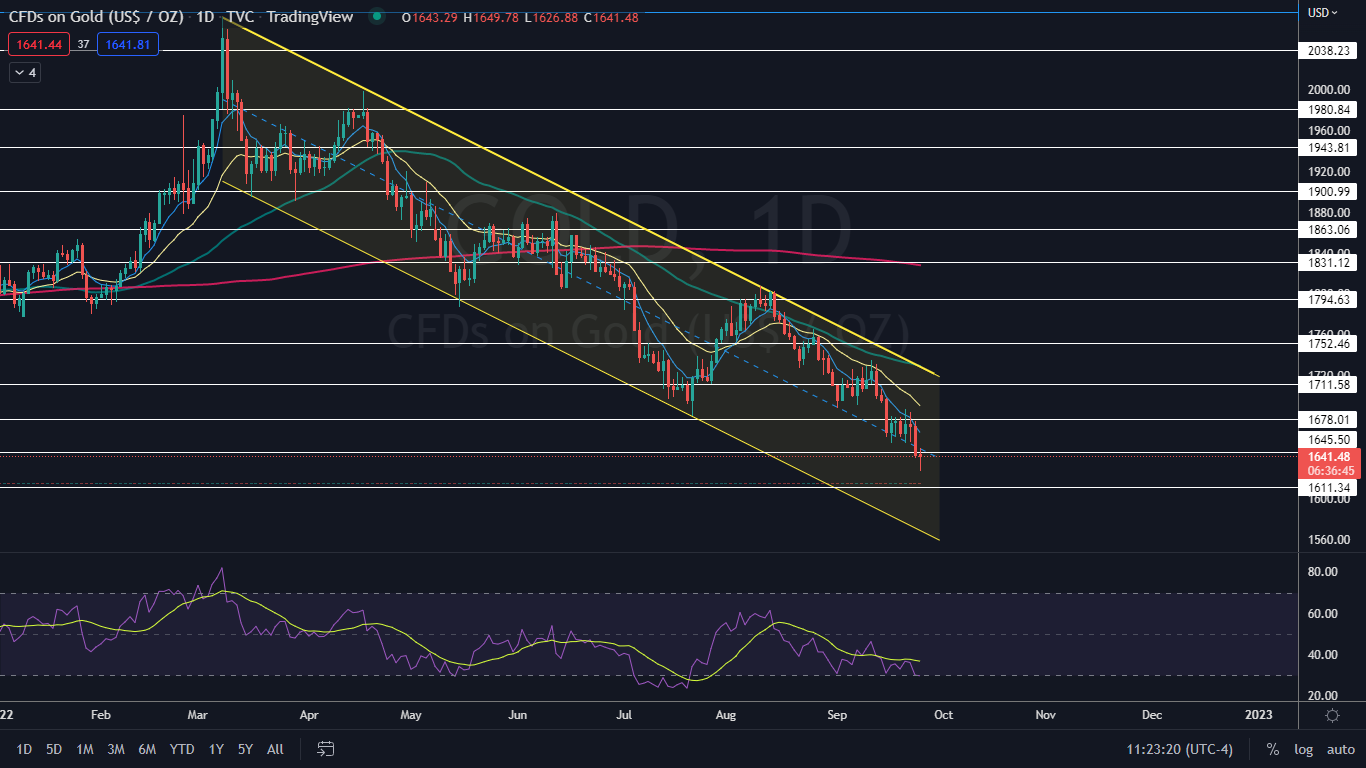
For now, gold is trading in a long-term downtrend between two parallel lines, which has set the commodity into a falling channel pattern. The pattern is considered to be bearish until a stock or commodity breaks up bullishly from the upper descending trendline of the channel.
There are a variety of tools one can use for technical analysis, including from Ninja Trader. Ninja offers advanced charting and other products as part of its trading suite that are designed to assist investors with navigating the markets. The platform allows its members to automate and execute trades and to test trading ideas through simulation.
See Also: Barrick Gold Whale Trades Spotted
The Gold Chart
Gold has been trading in a falling channel pattern since March 8, making a fairly consistent series of lower highs and lower lows on larger time frames. On Monday, gold attempted to break up above the median line of the channel but failed.
- A break up from the median line may take place on Tuesday, however, if gold closes the trading day near to flat. If that happens, gold will print a dragonfly doji candlestick on the daily chart, which could indicate a bounce is on the horizon.
- A bounce is likely to come over the next few days because gold’s relative strength index (RSI) is measuring in at about 30%. When a stock or commodities RSI nears or reaches the 30% level, it becomes oversold, which can indicate a a buying opportunity.
- When gold’s RSI reached the 30% level on Sept. 1 and Sept. 15, the commodity bounced up 2.73% and 1.4%, respectively, over the next few trading days.
- Gold has resistance above at $1,645.50 and $1,678.01 and support below at $1,611.34 and the psychologically important $1,600 level.
Edge Rankings
Price Trend
© 2025 Benzinga.com. Benzinga does not provide investment advice. All rights reserved.
Trade confidently with insights and alerts from analyst ratings, free reports and breaking news that affects the stocks you care about.

