


Zinger Key Points
- USO is trading in a confirmed downtrend, making a series of lower highs and lower lows.
- A bounce may be imminent because USO has entered into oversold territory on the daily chart.
- Feel unsure about the market’s next move? Copy trade alerts from Matt Maley—a Wall Street veteran who consistently finds profits in volatile markets. Claim your 7-day free trial now.
The United States Oil ETF USO attempted to bounce up on Monday but ran into a group of sellers who knocked the fund down about 2.5%.
The broad market sell-off, which has taken place amid recession fears, gripped USO in early June, bringing the fund down more than 30% since the June 8 52-week high of $92.20. The decline has outpaced the S&P 500, which has plunged 11.67% since that same date.
Over the course of this year, however, USO is up about 18% while the S&P 500 is down 23%.
Despite Russia’s invasion of Ukraine sparking fears of an oil shortage, which caused USO to gain ground during much of the first half of 2022, soaring inflation has hampered energy prices. In economic downturns, people travel less, which reduces oil consumption.
From a technical perspective, the longer-term trend for USO is down but the fund looks set for a bounce over the next few days due to USO entering into oversold territory on the daily chart.
There are a variety of tools one can use for technical analysis, including Ninja Trader. Ninja offers advanced charting and other products as part of its trading suite designed to assist investors with navigating the markets. The platform allows its members to automate and execute trades and to test trading ideas through simulation.
Want direct analysis? Find me in the BZ Pro lounge! Click here for a free trial
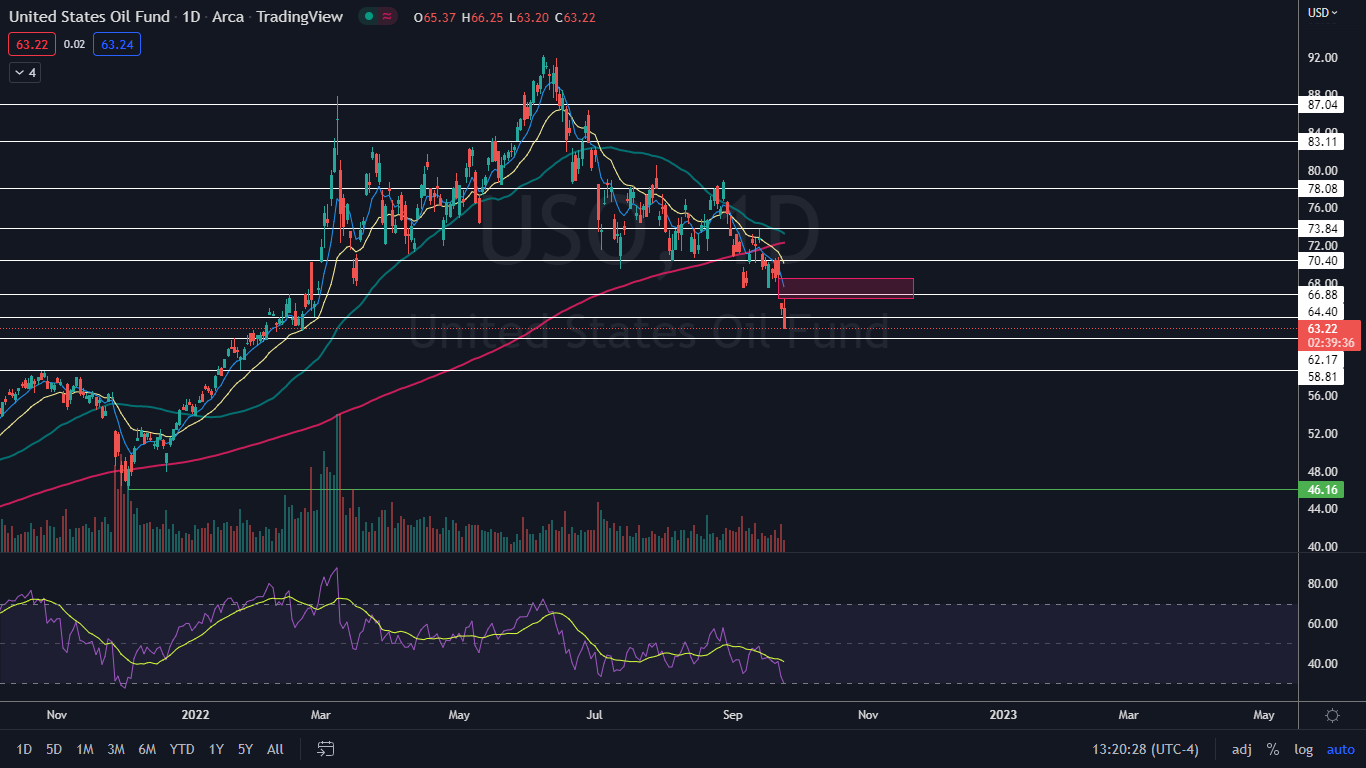
The USO Chart: USO entered into its most recent downtrend on Aug. 29 and has since made a consistent series of lower highs and lower lows. The most recent lower high was formed on Sept. 22 at $70.81 and the most recent confirmed lower low was printed at the $67.49 level on Sept. 19.
- On Monday, USO’s drop caused the relative strength index (RSI) to the 29% level. When a stock’s RSI nears or reaches the 30% level it becomes oversold, which can be a buy signal for technical traders.
- There’s a gap on USO’s chart between $66.25 and $68.53. Gaps on charts fill about 90% of the time, which makes it likely USO will rise up to fill the empty trading range in the future.
- If that happens, bearish traders can watch for USO to print a bearish reversal candlestick near the top of the gap for a possible solid entry point. Bullish traders will want to watch for the fund to print a bullish reversal candlestick over the next few days to signal a bounce is on the horizon.
- USO has resistance above at $64.40 and $66.88 and support below at $62.17 and $58.81.
 See Also: Germany Moves To Nationalize Gas Giant Uniper In €8B Deal To Avert Energy Supply Crisis
Photo: Shutterstock
Edge Rankings
Price Trend
© 2025 Benzinga.com. Benzinga does not provide investment advice. All rights reserved.
Trade confidently with insights and alerts from analyst ratings, free reports and breaking news that affects the stocks you care about.

