


Zinger Key Points
- The SPY reached oversold territory on Monday and Tuesday, indicating a bounce was likely to occur.
- In order for the ETF to negate its downtrend, a higher high or a higher low will need to form.
- Our government trade tracker caught Pelosi’s 169% AI winner. Discover how to track all 535 Congress member stock trades today.
The SPDR S&P 500 ETF Trust SPY was bouncing up about 1.6% higher on Wednesday after a series of bearish days dropped the ETF almost 12% between Sept. 12 and Tuesday.
Whether or not the market is about to experience another bull rally in the larger bear market, or whether Wednesday’s price action is just a short relief rally, will take some time to be seen.
Technical traders may have seen that at least a bounce was likely because the SPY’s relative strength index (RSI) was measuring in at under 30% on Monday and Tuesday, which put the ETF into oversold territory.
RSI is an indicator technical traders use to measure bullish and bearish price momentum. RSI levels can range between 0 and 100, with levels between 30 and 70 generally considered to be healthy.
When a stock or ETF’s RSI falls below the 30% level, it's considered to be oversold. When a stock enters oversold territory, it indicates the securities price no longer reflects the asset's true value, which can signal a reversal to the upside is in the cards.
When a stock or ETF’s RSI rises above the 70% area, it is considered to be overbought. When a stock enters overbought territory, it signals the securities price is elevated to its intrinsic value, which can signal a reversal to the downside is on the horizon.
RSI is best used when combined with other signals and patterns on a stock chart because stocks can remain in oversold and overbought territory for an extended period of time before reversing.
More experienced traders who wish to play the SPY either bullishly or bearishly may choose to do so through one of two Direxion ETFs. Bullish traders can enter a short-term position in Direxion Daily S&P 500 Bull 3X Shares SPXL and bearish traders can trade the inverse ETF, Direxion Daily S&P 500 Bear 3X Shares SPXS.
It should be noted that leveraged ETFs are meant to be used as a trading vehicle as opposed to long-term investments.
Want direct analysis? Find me in the BZ Pro lounge! Click here for a free trial
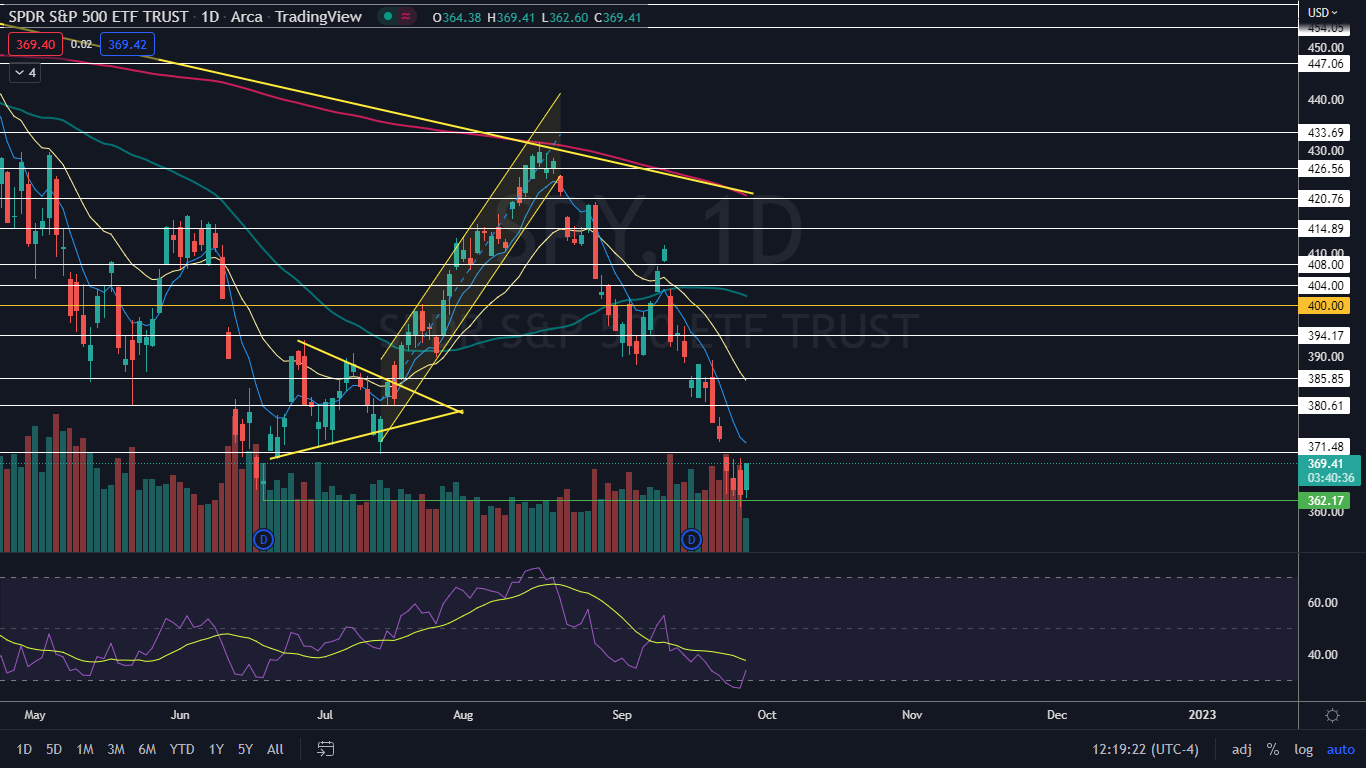
The SPY Chart: The SPY opened slightly higher on Wednesday in the middle of Tuesday’s trading range, which set the ETF into an inside bar pattern on the daily chart. The inside bar pattern is neutral in this case because although the SPY was trading lower before forming the pattern (bearish), a larger bounce may be on the horizon to bring the SPY’s RSI back up to a comfortable level (bullish).
- Traders can watch for the SPY to break up or down from Tuesday’s mother bar on higher-than-average volume later Wednesday to indicate future direction. If a break up from Tuesday’s range doesn’t take place, the SPY may continue to consolidate the recent sharp decline by trading sideways.
- The SPY is trading in a confirmed downtrend, with the most recent lower high formed on Sept. 21 at $394.16 and the most recent lower low printed at the $360.87 mark on Tuesday. If a larger reversal to the upside is on the horizon, bullish traders will want to see the SPY print a higher low over the next few trading days.
- The SPY has resistance above at $371.48 and $380.61 and support below at $362.
There are a variety of tools one can use for technical analysis, including Ninja Trader. Ninja offers advanced charting and other products as part of its trading suite that is designed to assist investors with navigating the markets. The platform allows its members to automate and execute trades and to test trading ideas through simulation.
 See Also:
 Photo: diez artwork via Shutterstock
Edge Rankings
Price Trend
© 2025 Benzinga.com. Benzinga does not provide investment advice. All rights reserved.
Trade confidently with insights and alerts from analyst ratings, free reports and breaking news that affects the stocks you care about.

