
Zinger Key Points
- Nvidia is trading in a confirmed downtrend, making a series of lower highs and lower lows.
- If the stock continues in the downtrend, a new 52-week low is the most likely outcome.
- Get the Real Story Behind Every Major Earnings Report
NVIDIA Corporation NVDA was trading about 3.5% higher on Monday, in tandem with the S&P 500, which was spiking up about 2.5% higher.
On Friday, when Nivida closed the trading session by printing an inverted hammer candlestick on the daily chart, a bounce to the upside became the most likely scenario, especially combined with the stock’s relative strength index level, which was in oversold territory.
As of Monday afternoon, Nvidia hadn’t surpassed Friday’s high-of-day price, which has settled the stock into an inside bar pattern.
An inside bar pattern indicates a period of consolidation and is usually followed by a continuation move in the direction of the current trend.
An inside bar pattern has more validity on larger time frames (four-hour chart or larger). The pattern has a minimum of two candlesticks and consists of a mother bar (the first candlestick in the pattern) followed by one or more subsequent candles. The subsequent candle(s) must be completely inside the range of the mother bar and each is called an inside bar.
A double, or triple inside bar can be more powerful than a single inside bar. After the break of an inside bar pattern, traders want to watch for high volume for confirmation the pattern was recognized.
- Bullish traders will want to search for inside bar patterns on stocks that are in an uptrend. Some traders may take a position during the inside bar prior to the break while other aggressive traders will take a position after the break of the pattern.
- For bearish traders, finding an inside bar pattern on a stock that's in a downtrend will be key. Like bullish traders, bears have two options of where to take a position to play the break of the pattern. For bearish traders, the pattern is invalidated if the stock rises above the highest range of the mother candle.
Want direct analysis? Find me in the BZ Pro lounge! Click here for a free trial
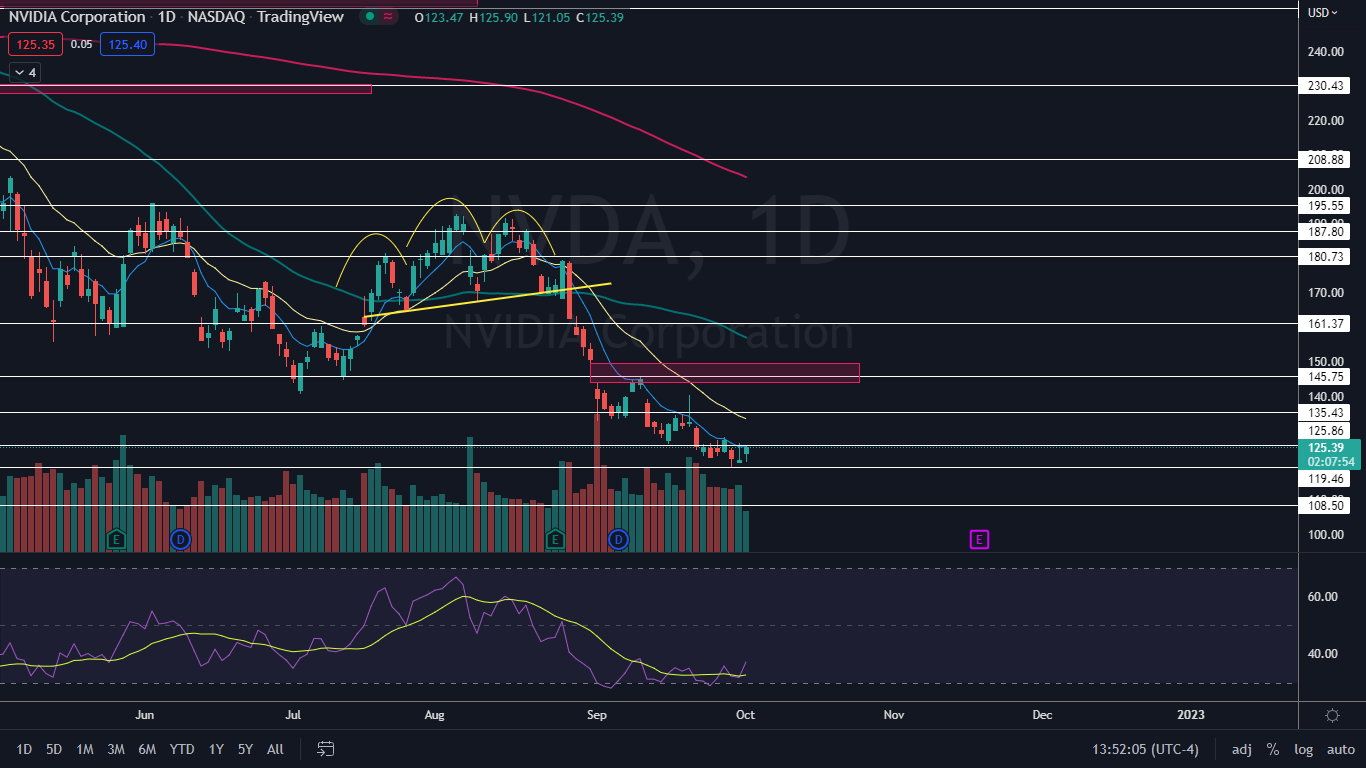
The Nvidia Chart: Nvidia’s inside bar pattern is neutral in this case because the stock has been trading mostly sideways for the last three trading days. Both bullish and bearish traders can watch for a break up or down from Friday’s mother bar on higher-than-average volume on smaller time frames to gauge future direction.
- Nvidia is trading in a downtrend, with the most recent high low formed on Sept. 28 at $128.23 and the most recent lower low printed at the $119.46 mark the following day. If Nvidia breaks up from Friday’s mother bar, bullish traders will want to see the stock rise up to print a higher high, which will negate the downtrend.
- If the stock rejects the $128 level and prints a bearish reversal candlestick, such as a doji or shooting star candlestick, the downtrend is likely to continue. If the downtrend continues, Nvidia is likely to make a new 52-week low over the coming days.
- Nvidia has resistance above at $125.86 and $135.43 and support below at $119.46 and $108.50.
 See Also: Prominent Apple, Tesla Analyst Warns Of More Pain For US Stocks In Coming Months
© 2025 Benzinga.com. Benzinga does not provide investment advice. All rights reserved.
Trade confidently with insights and alerts from analyst ratings, free reports and breaking news that affects the stocks you care about.

