Zinger Key Points
- Carnival and Norwegian are trading in falling channels, with Norwegian showing comparative strength.
- Bullish traders want to see the two stocks break up from the upper descending trendline of the pattern.
- China’s new tariffs just reignited the same market patterns that led to triple- and quadruple-digit wins for Matt Maley. Get Matt’s next trade alert free.
Carnival Corp CCL and Norwegian Cruise Line Holdings Ltd NCLH were flying up more than 8% and 9%, respectively, on Wednesday after bouncing from downtrends the two stocks slid into on Sept. 20.
Last week, Norwegian hosted an investor day, where the cruise line highlighted its 2023 priorities, which Norwegian believed could push the company toward a record-setting year. Next year, Norwegian will offer more upscale births than its competitors and increase its fleet by three ships, bringing in higher revenues and improving its margins.
UBS analyst Robin Farley upgraded Norwegian from Neutral to Buy and lowered the price target from $18 to $15. Farley also weighed in on Carnival Wednesday, maintaining a Buy signal and lowering the price target from $11 to $8.
From a technical standpoint, both airlines look set to climb higher over the coming days, although Norwegian is closer to making a bullish break from a falling channel pattern, which both of the cruise lines have been trading in.
It should be noted, however, that events affecting the general markets, negative or positive reactions to earnings prints and news headlines can quickly invalidate patterns and breakouts. As the saying goes, "the trend is your friend until it isn't" and any trader in a position should have a clear stop set in place and manage their risk versus reward.
Want direct analysis? Find me in the BZ Pro lounge! Click here for a free trial.
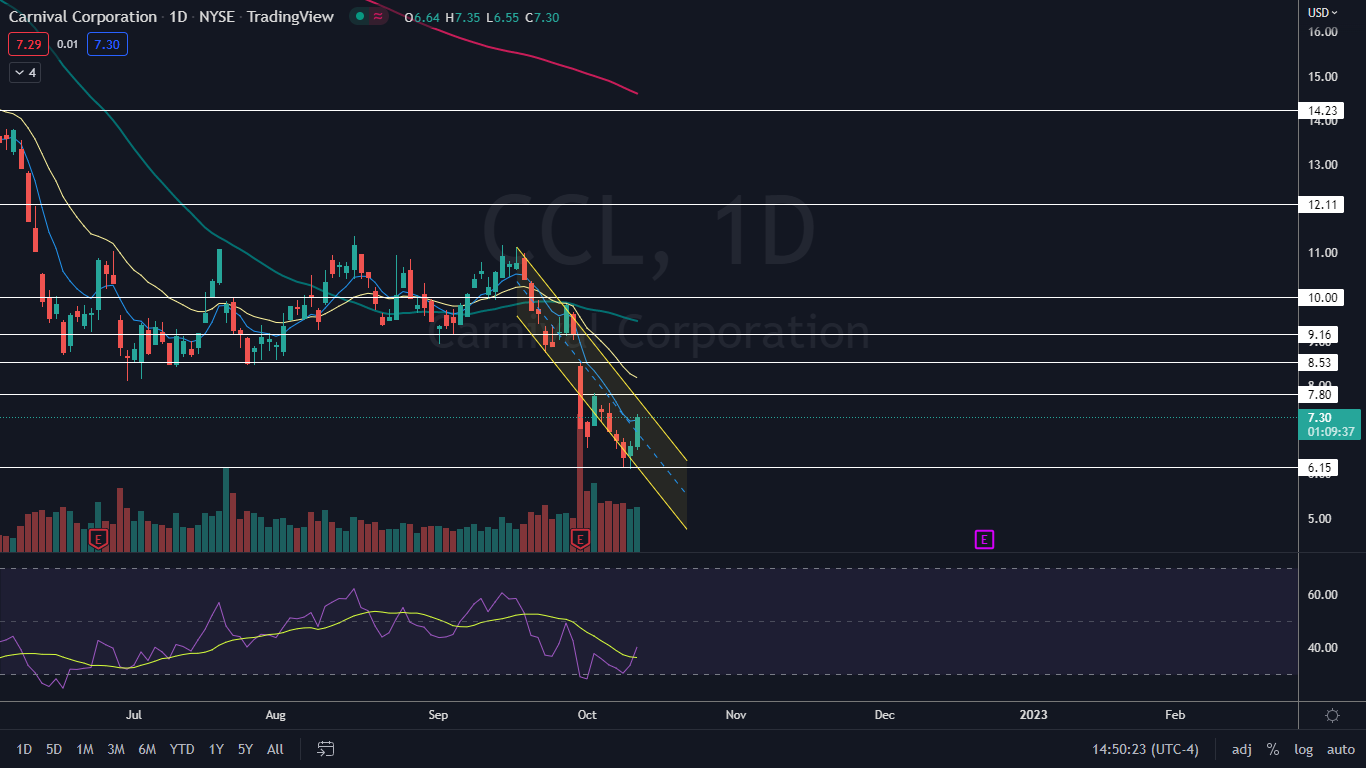
The Carnival Chart: Within Carnival’s falling channel pattern, the stock has been trading in a downtrend, making a series of lower highs and lower lows. Carnival’s most recent lower high within the pattern was printed on Oct. 4 at $7.82 and the most recent lower low was formed just above the $6 mark on Monday and Tuesday.
When Carnival bounced up from the $6 level during the last two trading days, the stock printed a bullish double bottom pattern. On Wednesday, Carnival was reacting to the pattern by surging higher. If the stock closes the trading session near its high-of-day price, Carnival will print a bullish Marubozu candlestick, which could indicate higher prices will come on Thursday.
If higher prices don’t occur on Thursday, Wednesday’s high-of-day price may become the next lower high within the downtrend. Bearish traders may then anticipate the stock will drop back down to the lower descending trendline of the channel.
Carnival has resistance above at $7.80 and $8.53 and support below at $6.15 and $5.
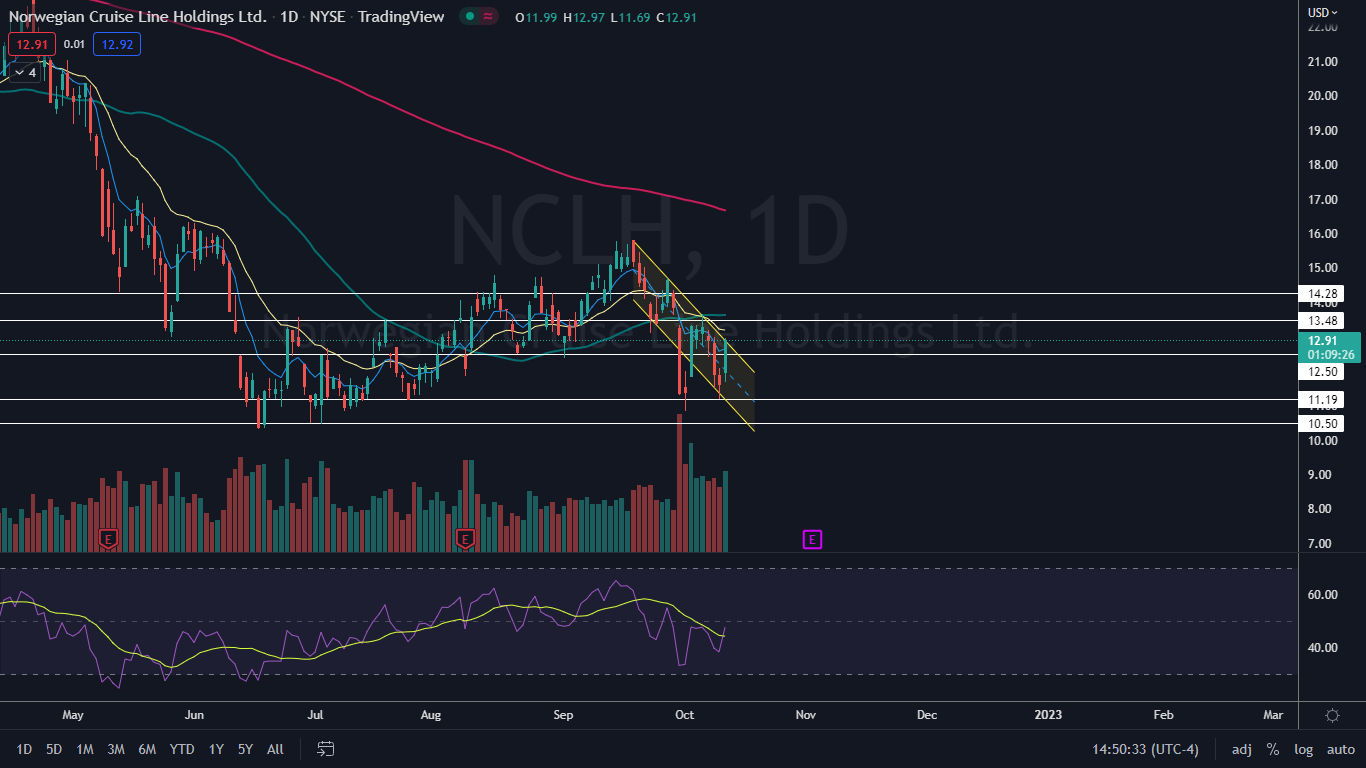
 The Norwegian Chart: Like Carnival, Norwegian has been trading in a downtrend between the two parallel lines of a falling channel pattern. On Wednesday, Norwegian reached the top upper trendline of the channel and was attempting to break up above the area, which would be bullish.
If Norwegian is able to close the trading session near its high-of-day, the stock will print a bullish Marubozu candlestick, which could indicate higher prices will come again on Thursday. If Norwegian closes the trading day up above the upper descending trendline of the channel, a longer-term reversal to the upside could be in the cards.
Norwegian has resistance above at $13.48 and $14.28 and support below at $12.50 and $11.19.
 See Also: How to Read Candlestick Charts for Beginners
Photo: Courtesy Carnival
Edge Rankings
Price Trend
© 2025 Benzinga.com. Benzinga does not provide investment advice. All rights reserved.
Trade confidently with insights and alerts from analyst ratings, free reports and breaking news that affects the stocks you care about.