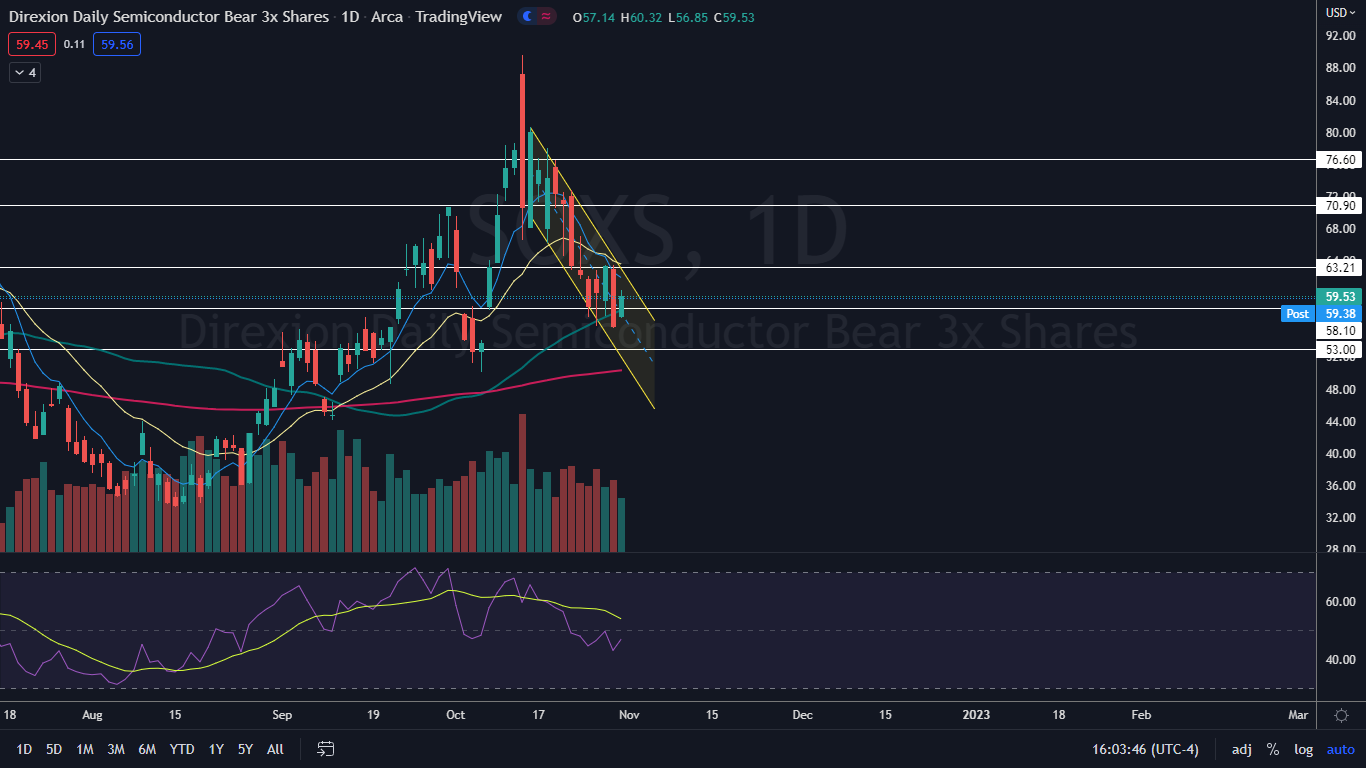
Direxion Daily Semiconductor Bear 3X Shares SOXS was trading up over 5% on Monday, rebounding from a bearish day on Friday, which dropped the ETF over 11%.
The semiconductor sector has recently reversed into a slight uptrend, with Advanced Micro Devices, Inc AMD and Nvidia Corporation NVDA trading higher since Oct. 13.
Read more about AMD's price action on Monday here
Due to the bullish action in the semiconductor sector, SOXS has been trading in a steep downtrend, losing over 32% since reaching an $89.59 high-of-day on that same day.
SOXS is a triple-leveraged fund that offers 3x daily short leverage to the PHLX Semiconductor Index. The ETF tracks inversely to a number of semiconductor companies through its holdings in three Dreyfus Government Cash Management Funds Institutional, weighted at a total of 58.29%.
SOXS’ recent downtrend has developed between parallel trendlines, which has settled the ETF into a falling channel pattern on the daily chart. The pattern is considered to be bearish until a stock or ETF breaks up from the upper descending trendline of the pattern.
If AMD receives a bearish reaction to its earnings print, scheduled for Tuesday after the market close, it could power SOXS to break up bullishly from the channel.
It should be noted that leveraged ETFs are meant to be used as a trading vehicle as opposed to a long-term investment by experienced traders. Leveraged ETF’s should never be used by an investor with a buy and hold strategy or those who have low risk appetites.
Want direct analysis? Find me in the BZ Pro lounge! Click here for a free trial.
The SOXS Chart: SOXS slid into a falling channel pattern on Oct. 14 and on Monday, the ETF opened slightly higher and was holding above the median line of the channel. The ETF also regained support at the 50-day simple moving average (SMA), which is bullish for SOXS and bearish for the semiconductor sector.
- Bullish SOXS traders will want to see the ETF break up from the upper descending trend line of the channel on higher-than-average volume. If that happens, it will be because AMD and NVDA have broken down from their uptrends.
- SOXS closed the trading day near its high-of-day price, which caused the ETF to print a bullish Marubozu candlestick. This could indicate higher prices will come on Tuesday. If higher prices do come, SOXS will regain the eight-day exponential moving average as support, which would be a good sign for bearish semiconductor traders.
- SOXS has resistance above at $63.21 and $70.90 and support below at $58.10 and $53.

Photo: Courtesy of shutterstock.com
© 2024 Benzinga.com. Benzinga does not provide investment advice. All rights reserved.
Comments
Trade confidently with insights and alerts from analyst ratings, free reports and breaking news that affects the stocks you care about.