


Zinger Key Points
- Nio may be forming a cup-and-handle pattern on the daily chart.
- If the stock prints a doji candlestick Friday, a retracement to the downside may be on the horizon.
- Feel unsure about the market’s next move? Copy trade alerts from Matt Maley—a Wall Street veteran who consistently finds profits in volatile markets. Claim your 7-day free trial now.
Nio, Inc NIO gapped up over 10% higher Friday and continued to climb intraday.
China-based stocks were boosted by the Hang Seng Index, which closed Friday’s session in Hong Kong up 5.36%.
Nio’s surge could be the beginning of a relief bounce, with the stock having spiked over 20% since Thursday’s opening price after plunging over 60% between Sept. 15 and Thursday’s $9.03 low.
Read more here about bullish action in China-based stocks.
Eventually Nio will need to enter a period of consolidation to take a breather from the two-day surge. When that occurs, traders and investors can watch for a cup-and-handle pattern to print on the stock’s daily chart.
A cup-and-handle pattern can be either a powerful reversal indicator when found at the bottom of a downtrend or a continuation pattern when found in an uptrend.
The pattern is formed when a security forms a rounded trough (cup) and then rises upwards before consolidating downward between two parallel lines (handle). The handle should begin to form before the stock has risen up as high as the top of the left side of the cup.
When the security breaks up through the handle on higher-than-average volume, it indicates the pattern was recognized, and a rally may follow.
- Aggressive bullish traders may choose to enter a security in a cup-and-handle pattern on the initial rise, with a stop below the lowest price in the cup. More conservative traders may wait to enter a position on a break up from the handle of the pattern on higher-than-average volume.
- Bearish traders may wait to enter into a position if the security falls below the lowest price within the cup formation, which negates the bullish cup-and-shoulder pattern and indicates an accelerated move to the downside may follow.
Want direct analysis? Find me in the BZ Pro lounge! Click here for a free trial.
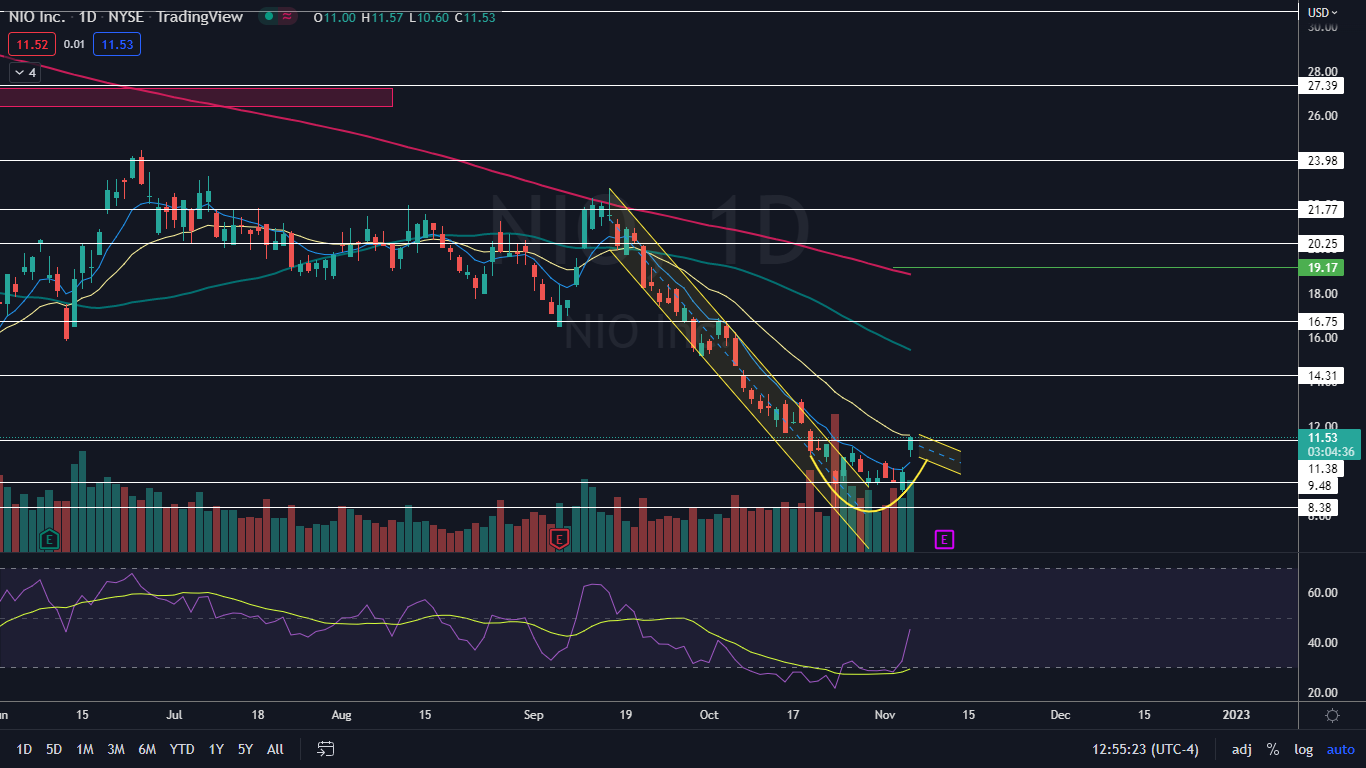
The Nio Chart: After breaking up from a falling channel pattern Oct. 26, Nio failed to gain the bullish momentum required to make a trend change and traded mostly sideways over the six trading days that followed. The sideways trading pattern has developed a rounded bottom, which may indicate a cup-and-handle pattern is about to occur.
- If the pattern takes shape, with Nio beginning to trend slightly lower in consolidation over the next few trading days, a handle to pair with the rounded bottom may print. If that happens, and Nio breaks up bullishly from the handle on higher-than-average volume, the measured move would be about 36%, which indicates the stock could soar up toward the $15 mark.
- Although Nio negated its sideways trading pattern on Friday, by printing a higher high above the most recent high of $10.45, a new trend hasn’t yet confirmed. If Nio consolidates lower and prints a higher low above $9.03, an uptrend may be on the horizon.
- If Nio closes the trading day within about 3% of the opening price or near the low-of-day, the stock will print a doji or shooting star candlestick, respectively, which could indicate the temporary top is in and a retracement is in the cards. If the stock closes the session near the high of day, the lower wick could indicate higher prices will come Monday.
- Nio has resistance above at $11.38 and $14.31 and support below at $9.48 and $8.38.
 See Also: Alibaba Climbs As Hang Seng Bounces In Relief: Here's What's Going On
Photo courtesy of Nio.
Edge Rankings
Price Trend
© 2025 Benzinga.com. Benzinga does not provide investment advice. All rights reserved.
Trade confidently with insights and alerts from analyst ratings, free reports and breaking news that affects the stocks you care about.

