Zinger Key Points
- CPI data injected bullish sentiment into the markets beginning Thursday.
- Eventually a retracement, at least to print a higher low, will come for the SPY.
- The ‘Trade of the Day’ is now live. Get a high-probability setup with clear entry and exit points right here.
The SPDR S&P 500 ETF Trust SPY gapped up about 0.7% higher to start Friday’s trading session and rallied a total of about 1% intraday to close the day at $398.51
The move was in continuation of the massive 5.5% surge the SPY made on Thursday.
The Week In Retrospect
The SPY began the week of Nov. 7 with an inside bar pattern on the weekly chart and continued to trade within last week’s range until Thursday, when the ETF broke up bearishly from the mother bar.
Although the week started out bullish, with the SPY closing Monday and Tuesday up a combined 1.5%, fear set in on Wednesday in anticipation of the release of consumer price index (CPI) data. On that day, the SPY plunged more than 2% lower to close under the Nov. 4 end-of-day price.
After CPI data released by the U.S. Bureau of Labor Statistics on Thursday morning showed inflation ticked lower in October, coming in at 7.7% versus the 8% estimate, the SPY rebounded significantly. The ETF gapped up 3.72% and continued to surge 1.71% intraday. The bullish reaction to the data caused the SPY to break bullishly up from last week’s range.
On Friday, the SPY moved higher in continuation but was beginning to show signs that the temporary top may be in.
The Week Ahead
Although many data sets from the government are set to be released next week, the following could have the most impact and cause potential volatility:
On Monday at 11 a.m., the New York Federal Reserve will release the results of its October Survey of Consumer Expectations, which indicates inflation expectations over 1-year, 3 years and 5-years. For September, 1-year inflation expectations dropped to 5.4% from 5.7% in August while the 3-year expectation rose from 2.8% to 2.9% from August to September and 5-year expectations jumped from 2% to 2.2% month-over-month.
On Nov. 16 at 8:30 a.m., the Commerce Department will release advance estimates of U.S. retail and food services sales numbers, including and excluding vehicles. For the month of September, consumer spending was flat.
On Nov. 17 at 8:30 a.m., the U.S. Department of Labor will release initial jobless claims for the week ending Nov. 12 and continuing jobless claims for the week ending Nov. 5. Initial jobless claims for the week ending Nov. 5 increased from 7,000 to 225,000, while continuing jobless claims for the week ending Oct. 29 increased to 1.493 million from 1.485 million the week prior.
The increase in jobless claims indicated the economy may be slowing, which could help hamper inflation.
The SPY Chart
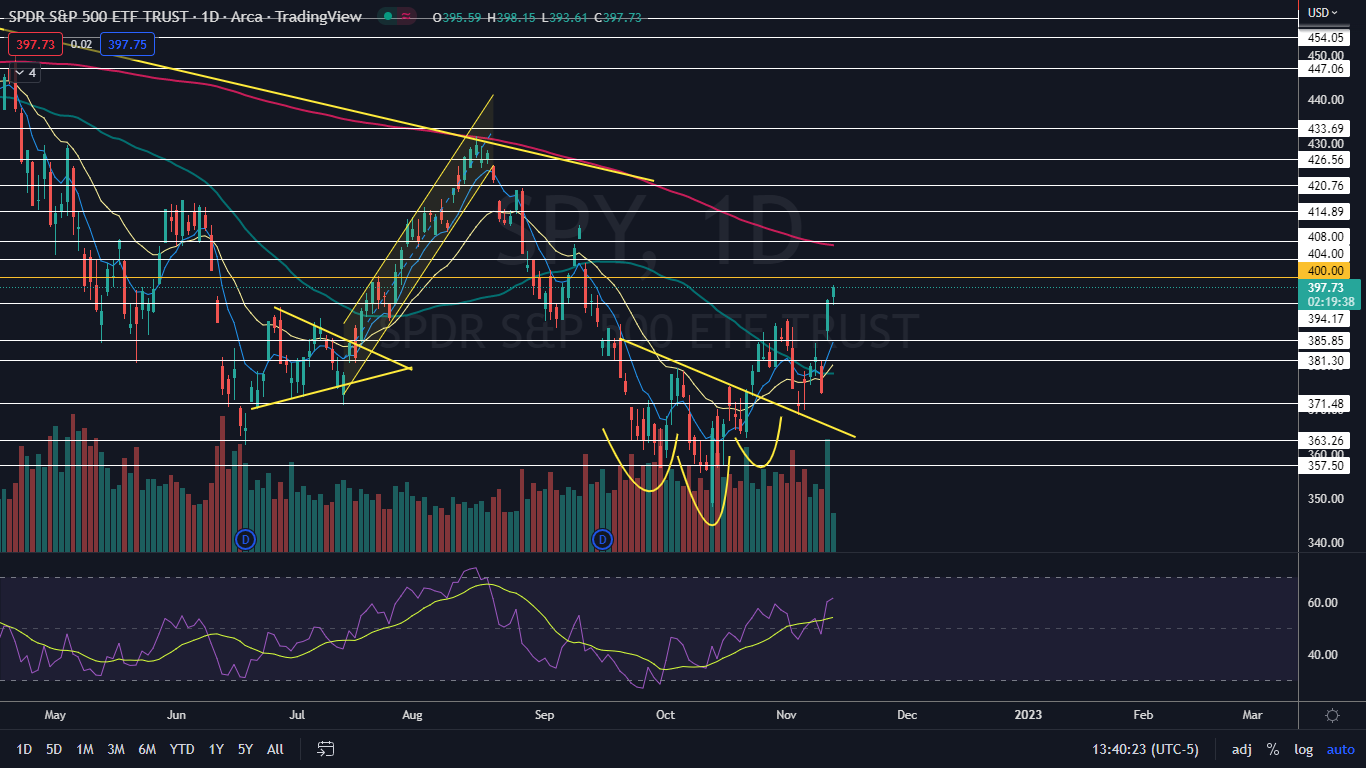
The SPY printed a bullish Marubozu candlestick on Friday after some morning volatility. A Marubozu candlestick is considered to be bullish, which could cause higher prices to come on Monday.
It should be noted, however, that candlestick patterns are lagging indicators that can’t be confirmed until the next candlestick within the pattern has been printed. Also, because the SPY has surged for two trading days in a row, consolidation in the form of an inside bar pattern may be in the cards.
The ETF may also trend lower or sideways over the next few days because the SPY is trading just under an important psychological level at $400. The area has acted as solid support and resistance in the past, which indicates it’s likely to do so again.
Bullish traders will want to see the SPY consolidate under $400, possibly setting up a bull flag pattern under the level, and then for big bullish volume to come in and break the ETF up. If the SPY is able to regain $400 and continue to trade in its uptrend, the next major battle will be at the 200-day simple moving average.
Bearish traders want to see the SPY drop significantly on Monday to lose support at the eight-day exponential moving average. If that area is lost, the SPY could also lose support at the 50-day SMA, which would put it in danger of negating the current uptrend.
The SPY has resistance above $400 at $404 and $408 and support below at $394.17 and $385.85.
Want direct analysis? Find me in the BZ Pro lounge! Click here for a free trial.
 See Also: US Consumer Sentiment Slips 8.7% In November: What It Means For The Markets
Photo: san4ezz via Shutterstock
Edge Rankings
Price Trend
© 2025 Benzinga.com. Benzinga does not provide investment advice. All rights reserved.
Trade confidently with insights and alerts from analyst ratings, free reports and breaking news that affects the stocks you care about.