Zinger Key Points
- Bullish traders are hoping the release of the Federal Reserve's monthly minutes show a more dovish tone.
- If the SPY receives a bullish reaction to the news, the ETF may regain the 200-day SMA as support.
- Brand New Membership Level: Benzinga Trade Alerts
The SPDR S&P 500 SPY was popping up 0.7% at one point on Wednesday after weekly jobless claims jumped to a three-month high, bringing renewed hopes the Federal Reserve’s tone may read more dovish when it releases the minutes from its November meeting at 2 p.m.
Despite the spike in the number of Americans filing for unemployment last week, the 240,000 jobless claims may not be enough to raise a red flag for the central bank.
The labor market has remained strong this year in the face of the Fed, which has enacted a tough series of interest rate hikes not seen since the 1980s in an attempt to cool the economy.
When the Fed releases the minutes from its meeting, traders and investors will be looking to glean information on whether the central bank is likely to hike rates by 0.75% for a fifth consecutive time in December.
Bullish traders would prefer to see information that suggests rising jobless claims and lower-than-expected consumer price index data for the month of October will prompt the Fed to relax its policy slightly with a 0.5% raise.
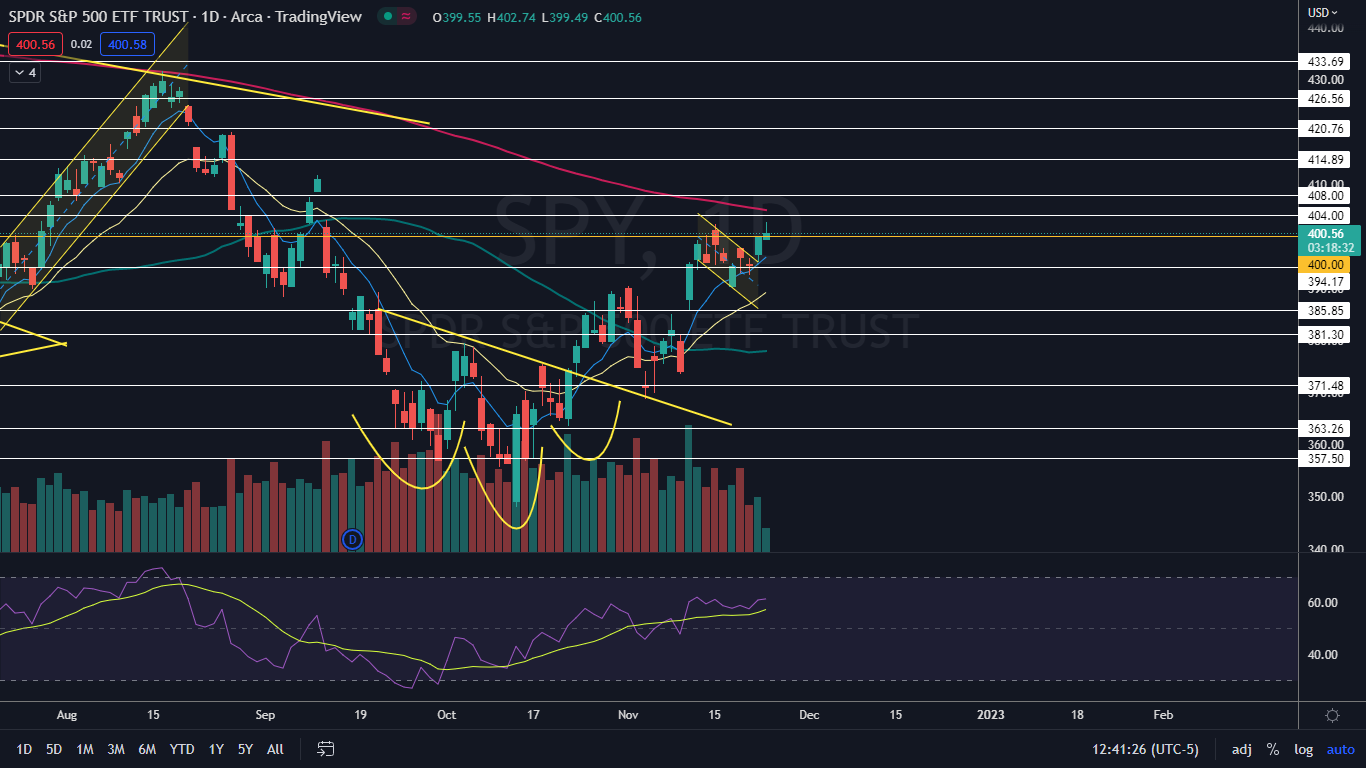
In the lead up to the event, the SPY spent eight trading days consolidating under the psychologically important $400 level before busting through the area on Wednesday. Whether or not the ETF can break through the next big level, at the 200-day simple moving average (SMA), will be determined when the SPY reacts to the information released at 2 p.m.
Want direct analysis? Find me in the BZ Pro lounge! Click here for a free trial.
The SPY Chart: The SPY busted up through the upper descending trendline of a falling channel pattern on Tuesday and moved higher with momentum on Wednesday, almost reaching the 200-day SMA. The ETF rejected near its high-of-day in the early afternoon and fell back to test the $400 level as support.
- If the SPY enjoys a bullish reaction to the Fed’s minutes, the ETF may break through the 200-day SMA, which would suggest the SPY may begin trading in a bull cycle. If the SPY has a bullish reaction to the event but is unable to break through the 200-day on the first attempt, it may need to consolidate under the area for a period of time.
- If the market ETF suffers a bearish reaction to the Fed’s minutes, the SPY will likely lose support at the $400 mark. If big bearish volume comes in, it could fall back into the falling channel pattern. In the event of a bearish reaction, the SPY’s high-of-day at $402.74 will print a bearish double top pattern when compared to similar price action on Nov. 15.
- If the SPY closes under $401.50, the ETF will print a shooting star candlestick, which could indicate lower prices will come again on Friday. If the SPY closes the trading day near its high-of-day price, the ETF will print a bullish Marubozu candlestick, which could indicate either higher prices or an inside bar is in the cards.
- The SPY has price history resistance above at $404 and $408 and support below the $400 level at $394.17 and $385.85.
Photo via Shutterstock.
© 2025 Benzinga.com. Benzinga does not provide investment advice. All rights reserved.
Trade confidently with insights and alerts from analyst ratings, free reports and breaking news that affects the stocks you care about.
 See Also: