Zinger Key Points
- GameStop was showing relative strength compared to the general market on Wednesday, holding slightly higher.
- Bullish traders want to see GameStop break up from its mother bar to regain support at the 50-day SMA.
- Feel unsure about the market’s next move? Copy trade alerts from Matt Maley—a Wall Street veteran who consistently finds profits in volatile markets. Claim your 7-day free trial now.
GameStop Corporation GME was popping slightly higher on Tuesday but on lower-than-average volume, which indicates a period of consolidation is taking place.
The consolidation was taking place in the form of an inside bar, which was holding in place despite the S&P 500 ticking slightly lower.
Read why GameStop is set to benefit from the $50 billion dollar gaming skin industry
Overall, since Sept. 1, GameStop has been trading sideways on low volume, indicating either accumulation or distribution is occurring.
Short sellers are hoping for the latter, having increased their positions over the last few weeks. As of Nov. 15, 54.66 million GameStop shares were held short, meaning 20.52% of the float, compared to 53.88 million shares held short as of Oct. 13.
The high and increasing number of shares held short escalates the chance of a short squeeze taking place although an increase in buying pressure followed by higher prices is needed to begin forcing shorts to cover their positions.
A catalyst to break GameStop from its sideways trading pattern could come next week on Dec. 7, when the company is expected to print its third-quarter financial report. Traders will be watching to see how GameStop has benefitted from the rising popularity of its in-game cosmetics and collectibles, as well as its non-fungible token (NFT) marketplace as the company continues to work toward upping its profitability.
Want direct analysis? Find me in the BZ Pro lounge! Click here for a free trial.
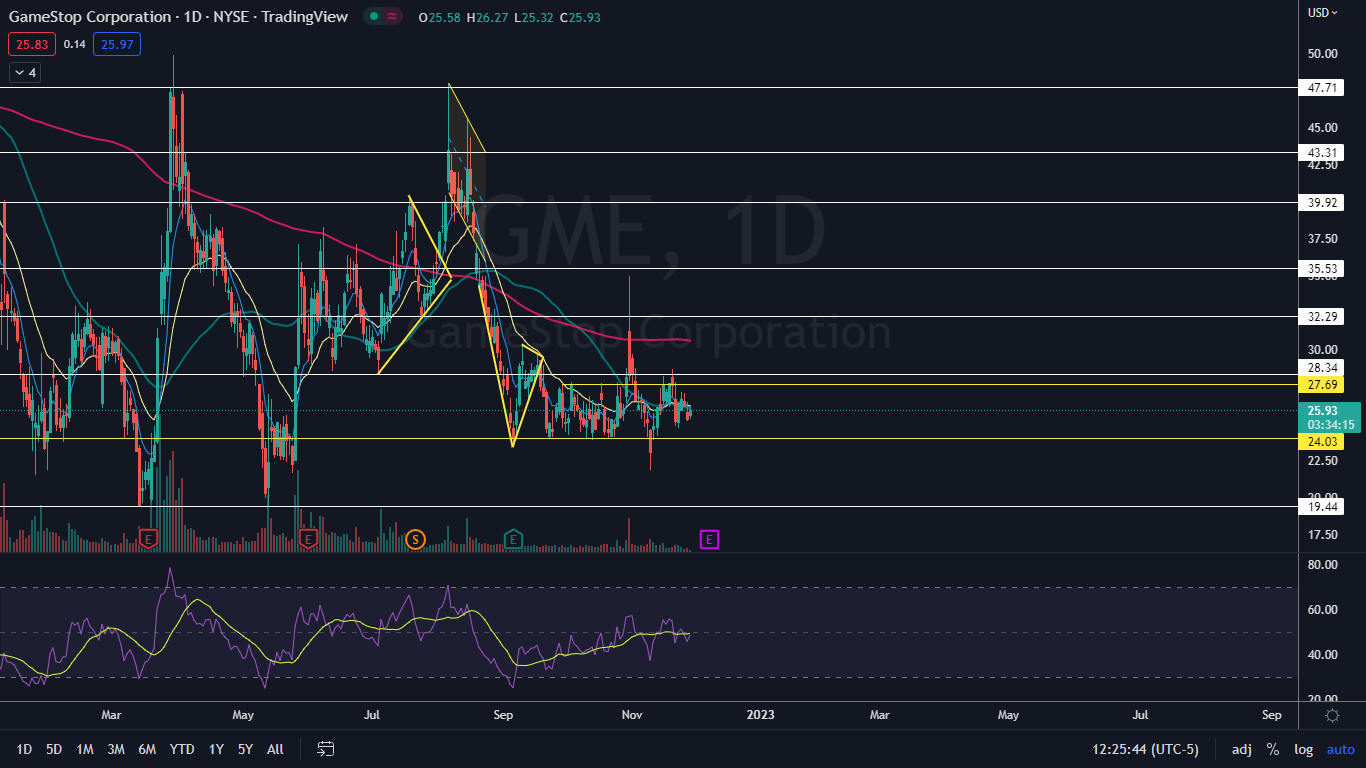
The GameStop Chart: GameStop has been mostly stuck in a range between $24.03 and $27.69 for the last three months, bouncing up and down between the price range. Although the stock has been trading mostly sideways, GameStop’s relative strength index has been steadily increasing, which suggests momentum may be returning into the stock.
- On Tuesday, GameStop attempted to break up from Monday’s mother bar but failed due to resistance above at the 50-day simple moving average (SMA). A death cross that occurred on GameStop’s chart on Oct. 7, when the 50-day SMA crossed under the 200-day SMA, indicated the bulls had lost control and that the two moving averages may become heavy resistance.
- Bullish traders want to see GameStop break up from Monday’s mother bar, which will cause the stock to regain the 50-day SMA as support. Bearish traders want to see big bearish volume come in and drop GameStop down under $24, which could indicate a larger decline is in the cards.
- GameStop has resistance above at $28.34 and $32.29 and support below at $24.03 and $19.44.
 See Also: Ken Griffin's Hedge Fund Increased Its Stake By Over 150% In These 2 Dividend-Paying Energy Stocks
Edge Rankings
Price Trend
© 2025 Benzinga.com. Benzinga does not provide investment advice. All rights reserved.
Trade confidently with insights and alerts from analyst ratings, free reports and breaking news that affects the stocks you care about.