


Zinger Key Points
- Netflix has been trading in a consistent uptrend, making a series of higher highs and higher lows.
- If the streaming giant continues to push higher, it may find resistance at the top of the upper gap.
- Feel unsure about the market’s next move? Copy trade alerts from Matt Maley—a Wall Street veteran who consistently finds profits in volatile markets. Claim your 7-day free trial now.
Netflix, Inc NFLX was climbing over 3.5% higher on Thursday in bullish continuation after a 9% surge on Wednesday caused the stock to burst up through the $300 mark.
The move higher was propelled by Fed Chair Jerome Powell, who suggested the central bank could begin easing back on its interest rate hikes starting as early as next month when he spoke at the Brookings Institution on Wednesday.
The S&P 500 surged on Powell’s remarks, closing up 3.15% and pulling many growth stocks up with it. On Thursday, the stock market ETF was consolidating, trading near to flat, but Netflix was showing comparative strength as it continued to push higher.
Netflix set an English language television streaming record for its series “Wednesday” over the Thanksgiving weekend, beating the previous record set by the fourth season of “Stranger Things.”
A return to streaming as winter approaches the Northern hemisphere could continue to boost Netflix’s revenues from increased streaming and new service sign ups.
Want direct analysis? Find me in the BZ Pro lounge! Click here for a free trial.
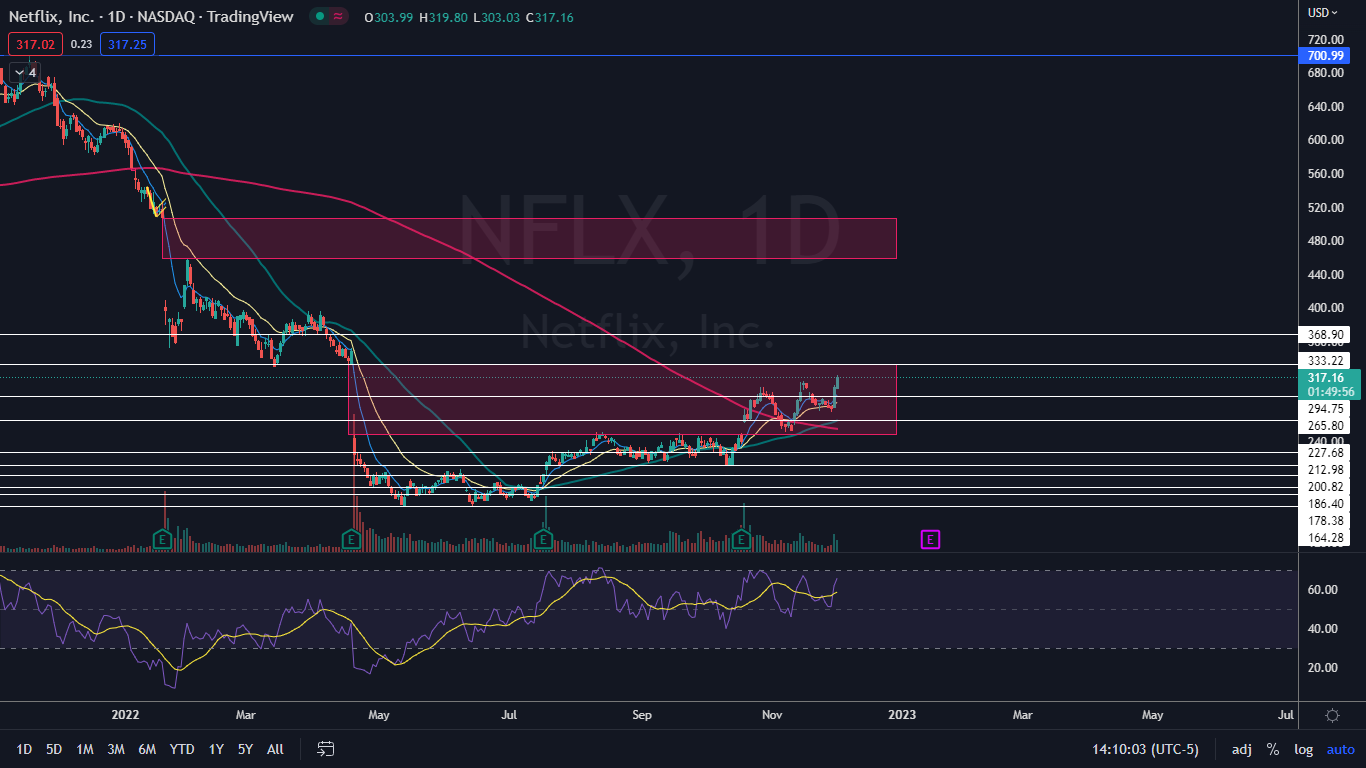
The Netflix Chart: Netflix entered into its most recent uptrend on Oct. 13 after printing a triple bottom pattern at $213 on that day and the two trading days prior.
Netflix’s most recent higher low within the uptrend was formed on Nov. 29 at $275.94 and the most recent confirmed higher high was printed at the $312.71 mark on Nov. 15.
- On Wednesday, Netflix printed a bullish Marubozu candlestick, which indicated the stock was likely to trade higher on Thursday. If Netflix closes the trading session at its high-of-day, the stock will print a second Marubozu candlestick, which could indicate continuation on Friday.
- Eventually Netlfix will print a temporary top and retrace to print at least another higher low. That is likely to occur soon because the stock’s relative strength index (RSI) is measuring in at about 65%.
- If Netflix continues to push higher, bearish traders can watch for the stock to print a possible bearish reversal candlestick at the top of the gap at $333. After the reversal to the downside takes place, bullish traders who aren’t already in a position can watch to see if the stock eventually prints a bullish reversal candlestick, such as a doji or hammer candlestick, above $278 for a possible entry.
- Netlfix has resistance above at $33.22 and $368.90 and support below at $294.75 and $265.80.
 Read Next: Why Is Netflix Stock Down So Much From Its Peak? CEO Reed Hastings Has A Scary Thought
Photo via Shutterstock.
Edge Rankings
Price Trend
© 2025 Benzinga.com. Benzinga does not provide investment advice. All rights reserved.
Trade confidently with insights and alerts from analyst ratings, free reports and breaking news that affects the stocks you care about.

