Zinger Key Points
- Although Nike negated its uptrend, the stock hasn't yet confirmed a downtrend.
- If the stock closes the trading day flat, Nike will print a dragonfly doji candlestick.
- Get two weeks of free access to pro-level trading tools, including news alerts, scanners, and real-time market insights.
Nike, Inc NKE was sliding 4% lower Tuesday as the company heads into its second-quarter earnings print after the close.
When Nike printed a first-quarter earnings beat on Sept. 29, the stock plunged 12% lower the following day. Although the company’s earnings came in ahead of estimates, revenue in China dropped 16% year-over-year, which spooked investors.
For the first quarter, Nike reported revenue of $12.7 billion, which beat the $12.27 billion consensus estimate. The company reported earnings per share of 93 cents, beating a consensus estimate of 92 cents.
For the second quarter, analysts, on average, estimated Nike will report earnings per share of 65 cents on revenues of $12.57 billion.
Ahead of the event, Credit Suisse analyst Michael Binetti maintained an Outperform rating on Nike and raised the price target from $110 to $122.
From a technical analysis perspective, Nike’s stock looks bearish over the longer-term but ready to bounce in the short term, because the stock hasn’t printed at least a lower high since Dec. 13.
It should be noted that holding stocks or options over an earnings print is akin to gambling because stocks can react bullishly to an earnings miss and bearishly to an earnings beat.
Want direct analysis? Find me in the BZ Pro lounge! Click here for a free trial.
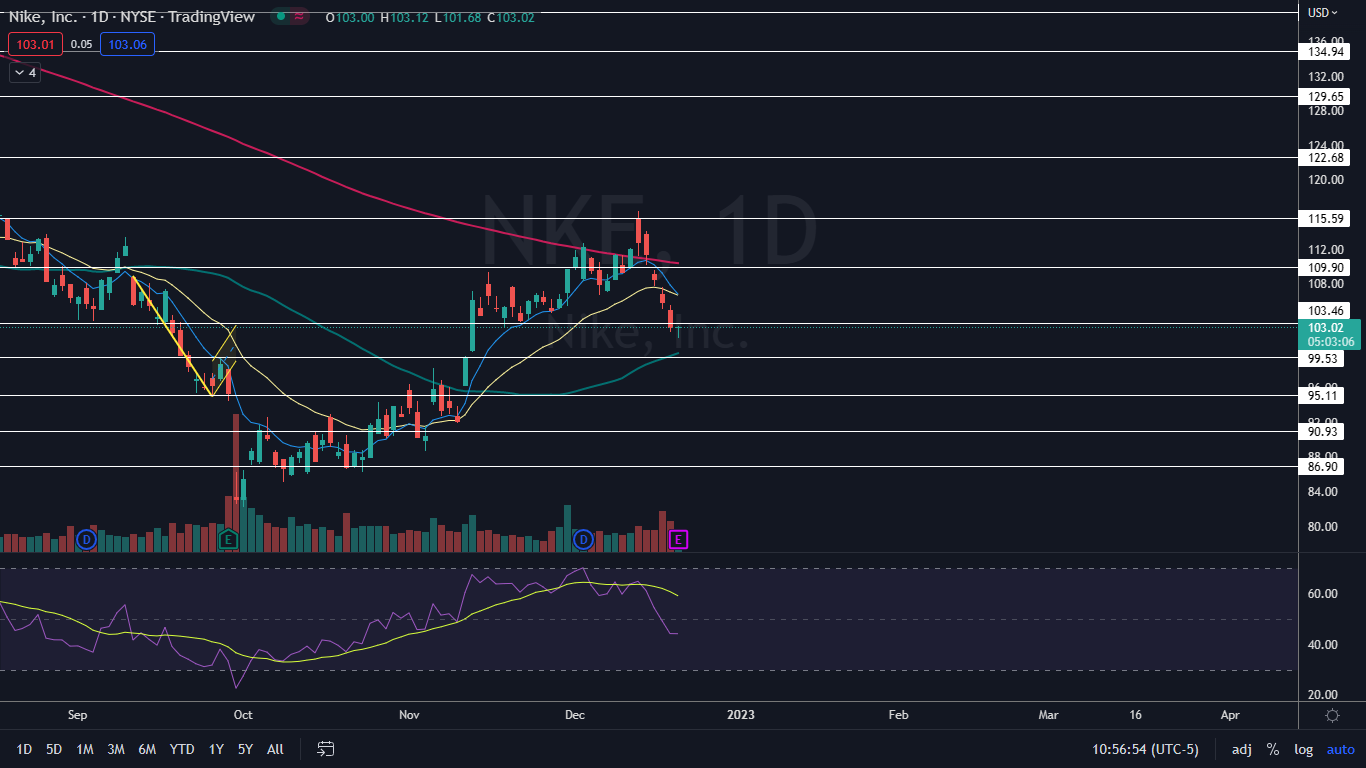
The Nike Chart: Nike negated its uptrend on Dec. 16 by printing a lower low under the most recent higher low of $106.75, which was created on Dec. 6. Although the uptrend is negated, a downtrend hasn’t yet been confirmed by the formation of a lower high.
- On Tuesday, Nike was working to print a dragonfly doji candlestick on the daily chart. If the candlestick pattern is recognized, Nike is likely to bounce on Wednesday. If sellers come in and cause Nike to close the trading day near its low-of-day price, the stock will print a bearish Marubozu candlestick, which could indicate lower prices are in the cards.
- When Nike rebounds, the stock may find resistance at the eight-day and 21-day exponential moving averages, which are trending at about $107. If the stock falls further, it may find support at the 50-day simple moving average, which is trending at $100.
- Nike has resistance above in the form of price history at $103.46 and $107.32 and support below at $99.53 and $95.11.

Read Next: EXCLUSIVE: Scottie Pippen On NFT Launch, Connecting With Fans In A New Way, Sneakers In Video Games
Photo: Shutterstock
© 2025 Benzinga.com. Benzinga does not provide investment advice. All rights reserved.
Trade confidently with insights and alerts from analyst ratings, free reports and breaking news that affects the stocks you care about.