Zinger Key Points
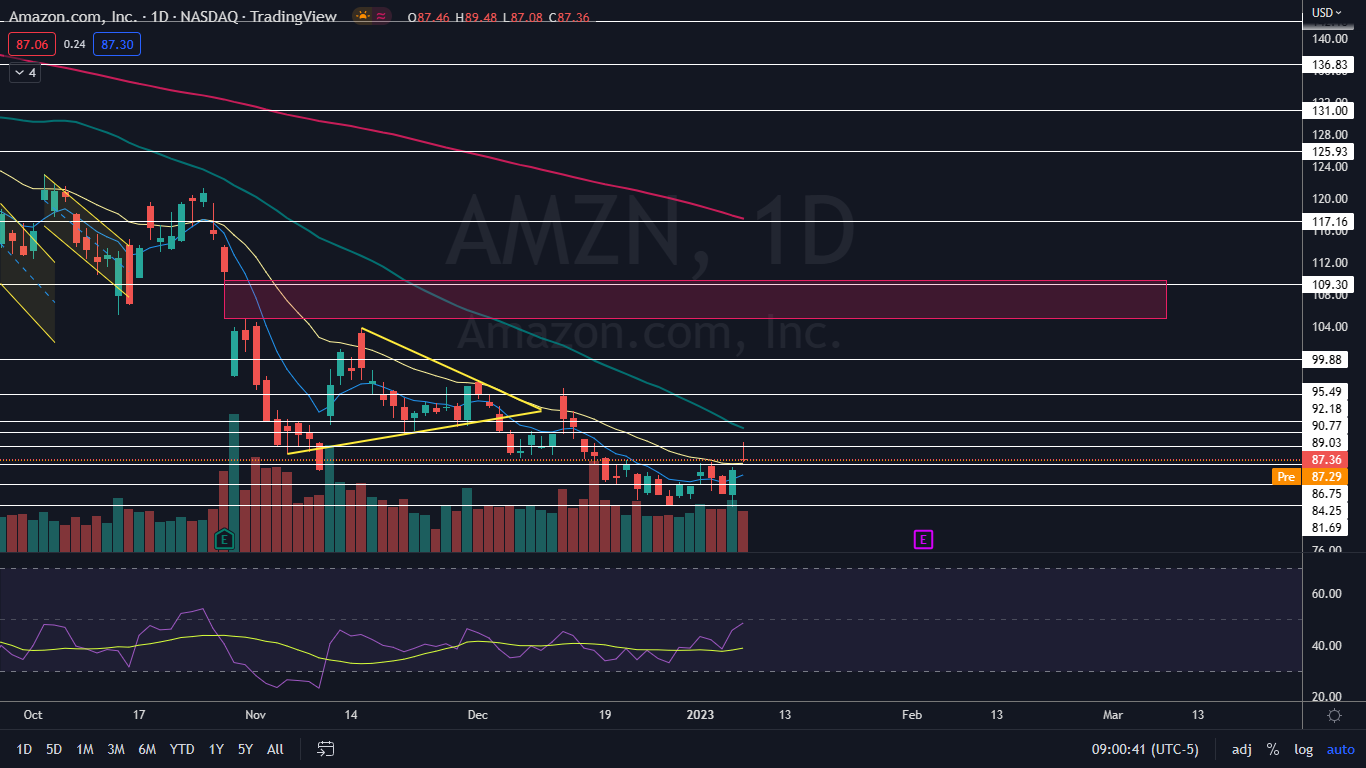
- Amazon printed a gravestone doji candlestick on Monday, which could indicate the temporary top is in.
- The spike higher was a reaction to a double bottom pattern, which was printed on Dec. 28 and Friday.
- Our government trade tracker caught Pelosi’s 169% AI winner. Discover how to track all 535 Congress member stock trades today.
Amazon.com, Inc AMZN was trading flat in the premarket Tuesday, in tandem with the S&P 500, which was sliding slightly as Federal Reserve chair Jerome Powell’s started his speech in Sweden.
The e-commerce and streaming giant closed Monday’s trading session 1.5% higher, helping the Nasdaq 100 to close green.
After a bullish morning on Monday, the market sold off in the afternoon, causing many tech stocks to print bearish candlesticks. Amazon also printed a candlestick indicating lower prices could come on Tuesday, closing the day with a gravestone doji candle.
A gravestone doji candlestick forms when a red or green candlestick prints, with a long upper wick and a small-to-almost non-existent body, which indicates the opening and closing prices are close to flat.
A gravestone doji, when found in an uptrend, can indicate a reversal to the downside is on the horizon. It is a lagging indicator, however, because the next candle on the timeframe being studied must print before the pattern can be validated.
A gravestone doji candlestick doesn’t necessarily mean a new downtrend will occur, only that a retracement lower is likely imminent.
Candlestick patterns can be used to indicate the future price direction of a stock. Candlestick patterns are especially useful for technical traders when they are combined with other indicators such as larger patterns, trading volume, relative strength index (RSI) and divergences between RSI and price action.
Want direct analysis? Find me in the BZ Pro lounge! Click here for a free trial.
The Amazon Chart: Amazon’s spike higher on Monday occurred after the stock printed a double bottom pattern near the $81 mark on Dec. 28 and Friday. The stock then reacted to the pattern and popped slightly higher to print a gravestone doji.
- Although Amazon negated its downtrend on Jan. 4, by printing a higher high of $86.98, the stock hasn’t yet confirmed a new uptrend is in the cards. For an uptrend to confirm, Amazon will need to retrace lower to print a higher low above $82.
- If the stock trends lower on Tuesday, bullish traders can watch for Amazon to print a possible bullish reversal candlestick, such as a doji or hammer candlestick, above that level, to indicate the higher low has occurred and the stock will trade higher.
- Bearish traders want to see big bearish volume come in and knock Amazon down under the $81 mark, which could indicate Monday’s spike was a bull trap and the downtrend will continue.
- Amazon has resistance above at $89.03 and $90.77 and support below at $86.75 and $84.25.

Read Next: Should You Be Worried About Job Cuts At Goldman, Amazon Or Salesforce? One Important Caveat
Photo: courtesy of Shutterstock.
© 2025 Benzinga.com. Benzinga does not provide investment advice. All rights reserved.
Trade confidently with insights and alerts from analyst ratings, free reports and breaking news that affects the stocks you care about.