


Zinger Key Points
- The SPY is trading in an uptrend and an inside bar pattern, just below the 200-day SMA.
- If the SPY regains the 200-day SMA as support, bullish traders will want to see the ETF pop above the descending trendline.
- With stocks plunging, steady income is key. Tim Melvin & Ryan Faloona reveal dividend stocks and deep-value plays on April 8. Reserve your spot now.
The SPDR S&P 500 SPY opened 0.84% lower Friday after the futures market began to slide just after 6 a.m.
The SPY was likely to retrace because on Thursday, the stock market fund was unable to close the trading session above the 200-day simple moving average (SMA).
The 200-day SMA is an important bellwether. Technical traders and investors consider a stock trading above the level on the daily chart to be in a bull cycle, whereas a stock trading under the 200-day SMA is considered to be in a bear cycle.
The 50-day SMA also plays an important role in technical analysis, especially when paired with the 200-day. When the 50-day SMA crosses below the 200-day SMA, a death cross occurs. When the 50-day SMA crosses above the 200-day, a bullish golden cross takes place.
On Friday, bulls bought the dip and the SPY was spiking up toward the 200-day SMA again. Since Jan. 4, 2022, the SPY has tagged the 200-day SMA a number of times, even crossing over the level temporarily on a few occasions. Each time in 2022 when the SPY regained the 200-day, the bears quickly took back control and dropped the ETF back below the area.
This often set the SPY into a steep downtrend. Between Nov. 30 and Dec. 14, the SPY traded around the 200-day SMA before eventually settling into another downtrend and dropping 8.64% between Dec. 13 and Dec. 22, when the ETF started to trade sideways in consolidation.
It should be noted that when zooming out to the two-day SPY chart, it appears the sideways price action may have been an accumulation zone because of the lower wicks on each candlestick.
On Jan. 6, the SPY broke bullishly up from the horizontal pattern and made its way back up to the 200-day over the trading days that followed.
Whether the SPY can regain the area as support and remain trading above the level in an uptrend is yet to be seen, but traders will be watching for signs of a larger reversal to the upside, or for signs that another rejection is on the horizon.
Want direct analysis? Find me in the BZ Pro lounge! Click here for a free trial.
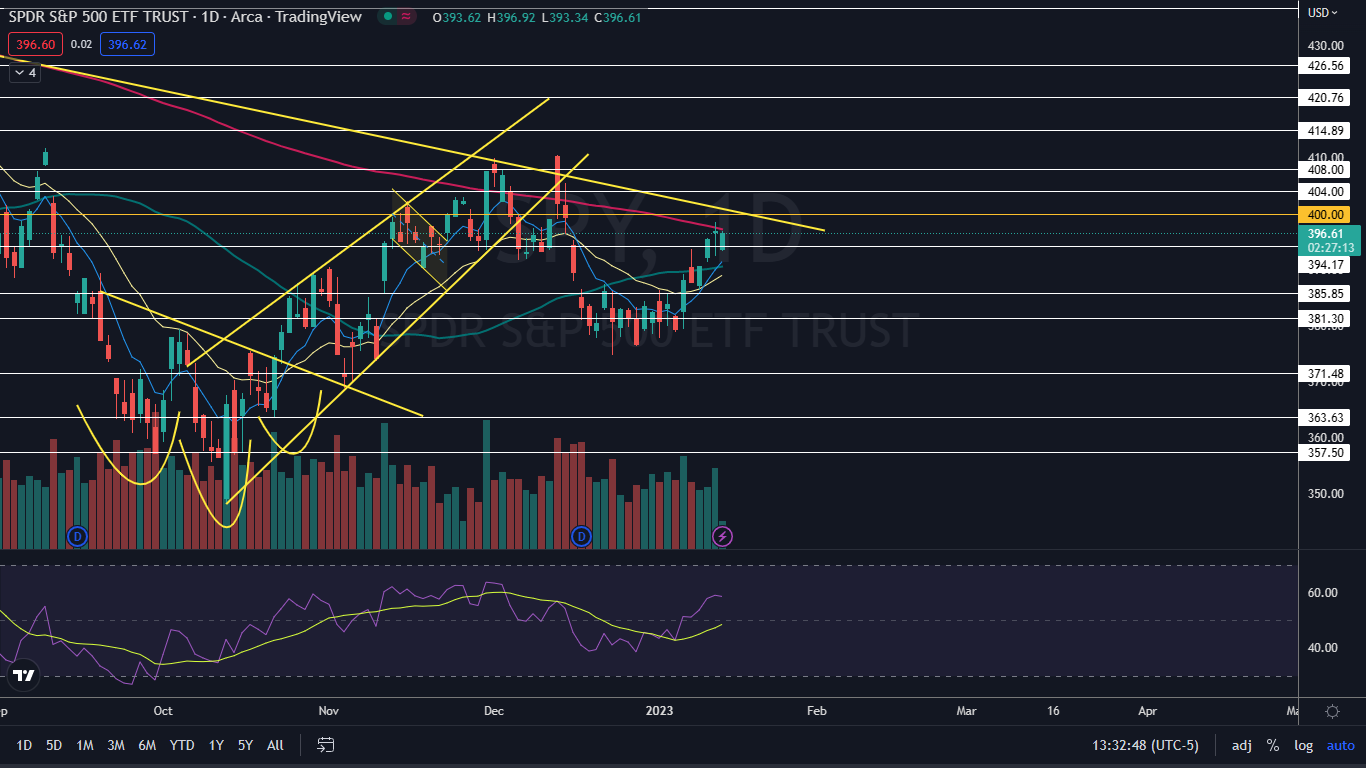
The SPY Chart: If the SPY regains the 200-day SMA as support, it is likely to pop up to an important descending trendline that has been acting as resistance since Jan. 4, 2022.
Each time the SPY has regained the 200-day SMA, the descending trendline has forced the ETF lower, hampering any chance of a bull cycle.
- Bullish traders will see it as a positive sign the 50-day SMA has been trending higher toward the 200-day. The 50-day hasn’t been as close to the 200-day since April 2022, and if the SPY is able to regain the 200-day SMA as support and trend above the area for a shorter amount of time, the 50-day will cross above the 200-day, which would cause a golden cross to form.
- The SPY is trading in an uptrend, with the most recent higher low formed on Tuesday at $386.27 and the most recent higher high printed at the $398.49 mark on Thursday.
- On Friday, the SPY was printing a bullish-leaning inside bar pattern, and if the ETF breaks up above Thursday’s high-of-day, the uptrend will be intact and the SPY will regain the 200-day.
- The SPY may consolidate under or on top of the 200-day SMA for a period of time. Bearish traders would like to see that take place into fourth-quarter earnings season and then for a series of big tech earnings misses to cause the ETF to react negatively.
- If that happens, the bear cycle is likely to continue and bullish traders will be looking for small short-term bounces within a new downtrend.
- The SPY has resistance above at $400 and $404 and support below at $394.17 and $385.85.
 Read Next: Was Fed Chair Jerome Powell The Big Bad Wolf Of 2022? Will His Reputation Turn In 2023?
Photo via Shutterstock.
Edge Rankings
Price Trend
© 2025 Benzinga.com. Benzinga does not provide investment advice. All rights reserved.
Trade confidently with insights and alerts from analyst ratings, free reports and breaking news that affects the stocks you care about.

