Zinger Key Points
- Although Amazon negated its daily downtrend, the stock hasn't confirmed an uptrend with the formation of a higher low.
- Bearish traders want to see big bearish volume drop Amazon below the 50-SMA.
- Find out which stock just plummeted to the bottom of the new Benzinga Rankings. Updated daily—spot the biggest red flags before it’s too late.
Amazon.com Inc AMZN was dropping 1.4% on Thursday after a volatile day on Wednesday, saw the stock trade both above and below Tuesday’s trading range.
While the S&P 500 closed Wednesday’s session down 1.56%, Amazon declined a more moderate 0.61%, showing comparative strength.
On Wednesday, the e-commerce and streaming giant notified employees in the U.S., Canada and Costa Rica of layoffs, according to a report. The move is part of Amazon’s plan to layoff 18,000 employees globally. The latest layoffs impact Amazon’s retail and human resources departments.
Want direct analysis? Find me in the BZ Pro lounge! Click here for a free trial.
The Seattle-based e-commerce giant also announced it will wind down its charity AmazonSmile by Feb. 20. The company, like many of its peers, is grappling with high inflation and steeply rising interest rates, which have caused consumers to tighten their spending.
On Thursday, Amazon gapped down slightly to start the trading day, in tandem with the S&P 500. Traders and investors are watching the S&P 500 to see if Wednesday’s decline was another hard rejection or a pullback. How the S&P 500 behaves over the next few trading days is likely to determine whether Amazon can continue showing strength.
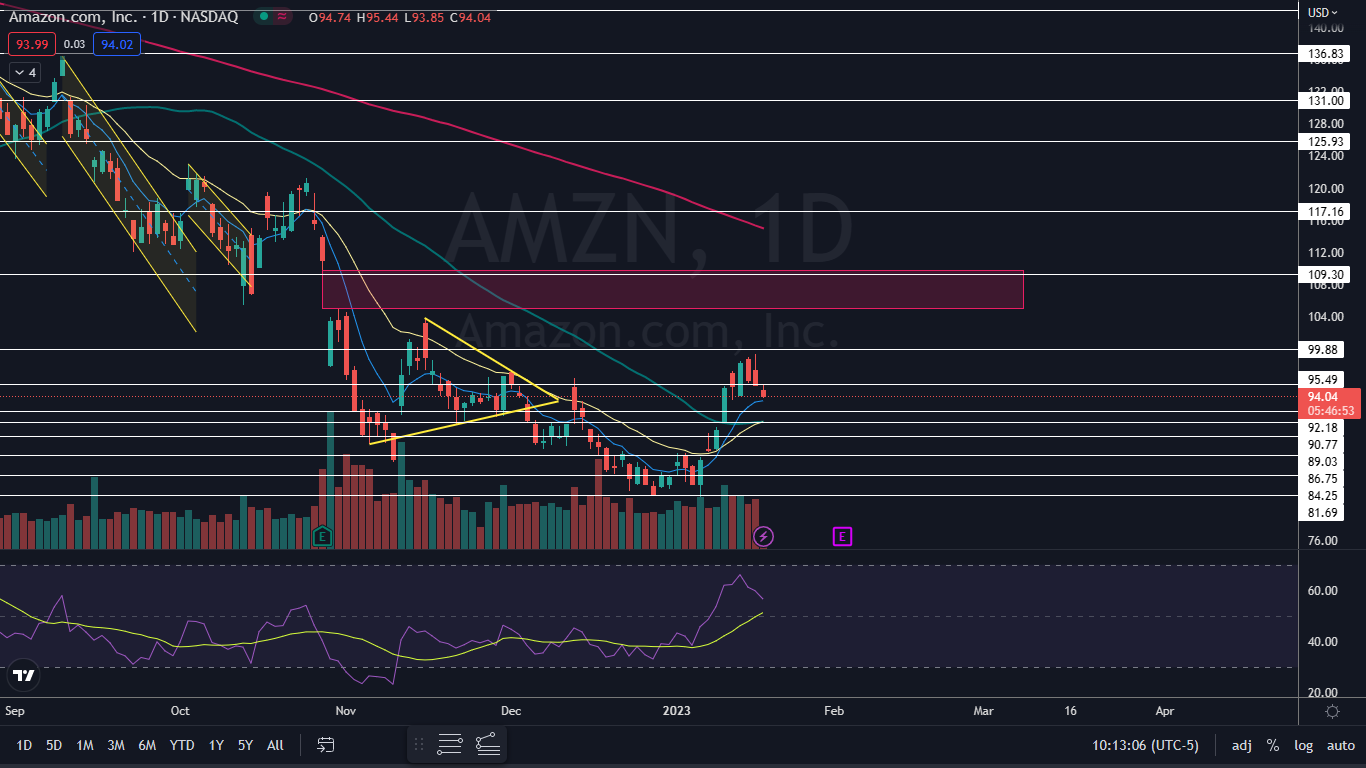
The Amazon Chart: Amazon reversed north on Jan. 6, after creating a bullish double bottom pattern near $81, when paired with similar price action on Dec. 28. Between Jan. 6 and Wednesday’s high-of-day, Amazon soared almost 22% and negated its prior downtrend.
- Although Amazon negated its downtrend, the stock hasn’t yet confirmed a new uptrend on the daily chart by printing a higher low. If Amazon continues to decline over the next few trading days, bullish traders will want to see the stock print a reversal candlestick, such as a doji or hammer candlestick, to indicate a higher low has occurred and an uptrend is in the cards.
- Bearish traders want to see big bearish volume come in and knock Amazon down under the eight-day and 21-day exponential moving averages and the 50-day simple moving average. If that happens, the moving averages are likely to act as resistance and could drop the stock into a downtrend.
- Amazon has resistance above at $95.49 and $99.88 and support below at $92.18 and $90.77.
 Read Next: Apple's New $299 HomePod Could Save Lives
Edge Rankings
Price Trend
© 2025 Benzinga.com. Benzinga does not provide investment advice. All rights reserved.
Trade confidently with insights and alerts from analyst ratings, free reports and breaking news that affects the stocks you care about.