Zinger Key Points
- Tesla is trading in an uptrend, making a series of higher highs and higher lows.
- The EV-stock's volatility has decreased as its competition in the space has increased.
- Get 5 stock picks identified before their biggest breakouts, identified by the same system that spotted Insmed, Sprouts, and Uber before their 20%+ gains.
Tesla, Inc TSLA was trading slightly higher in the premarket on Friday, erasing its Thursday loss.
The stock has been frustrating traders over the last year. It fell sharply over most of 2022 but slowly rebounded in 2023. The huge 5% to 15% daily increases and decreases in Tesla’s stock price, which were common prior to the first half of 2022, used to excite traders who enjoy volatility for scalping and short-term trades.
Although large swings in Tesla’s stock price have become rare, investors and swing traders may see the stock’s climb since Jan. 6 as a welcomed sight. Since that date, Tesla has climbed almost 25% within an uptrend, making a consistent series of higher highs and higher lows.
See Also: What Tesla's Trading Range Could Look Like Next Week
The recent lack of volatility may be due to traders and investors diversifying the EV portion of their portfolios. Over the last few years but especially during 2022, several legacy automakers have increased the number of electric vehicle models they produce, ramping up competition for Tesla in the “pure play” EV space.
Tesla’s increased competition in the marketplace caused Korean Investment Management, an EV-specific mutual fund, to decide to decrease its investment in the Austin, Texas-based company from 9% of its net value to 2%. The fund also cited Tesla CEO Elon Musk’s decision to sell some of his Tesla stake to purchase Twitter as a cause for concern.
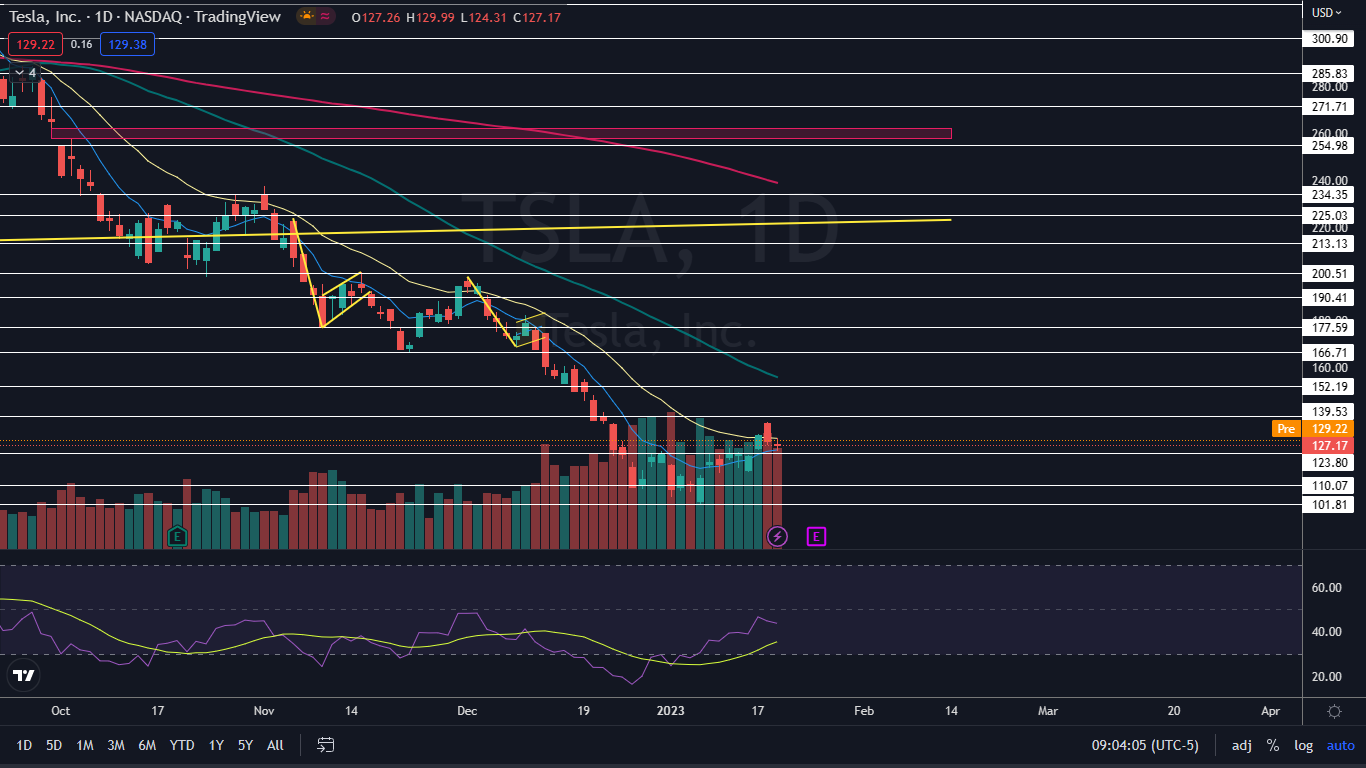
From a technical perspective, Tesla looks set to trend higher within its uptrend and printed a reversal candlestick on Thursday, which could indicate higher highs are in the cards for Friday.
Want direct analysis? Find me in the BZ Pro lounge! Click here for a free trial.
The Tesla Chart: If Tesla rebounds on Friday, bullish traders want to see the stock pop up above Wednesday’s high-of-day at the $136.56 mark. If Tesla falls under the Jan. 15 low of $115.60 or prints a lower high under $136, the uptrend will be negated.
- On Thursday, Tesla printed a doji candlestick, closing near to flat. When a doji candlestick is found during a retracement, it can indicate the local bottom is in. It should be noted, however, that candlesticks are lagging indicators.
- Tesla is trading above the eight-day exponential moving average (EMA) and below the 21-day EMA. Bullish traders want to see the stock regain the 21-day EMA as support and remain above the level for a period of time, which would cause the eight-day EMA to cross above the 21-day.
- Bearish traders want to see big bearish volume come in and drop Tesla down to print a lower low. If that happens, a downtrend could eventually confirm.
- Tesla has resistance above at $139.53 and $152.19 and support below at $123.80 and $110.07.
 Read Next: Elon Musk Supervised Tesla's 2016 Self-Driving Video: Report
© 2025 Benzinga.com. Benzinga does not provide investment advice. All rights reserved.
Trade confidently with insights and alerts from analyst ratings, free reports and breaking news that affects the stocks you care about.