Zinger Key Points
- The SPY burst up through a descending trendline Monday but was having difficulty holding above the level.
- If the market ETF closes under the trendline, bullish traders want to see the SPY hold above the 200-day SMA.
- Don't face extreme market conditions unprepared. Get the professional edge with Benzinga Pro's exclusive alerts, news advantage, and volatility tools at 60% off today.
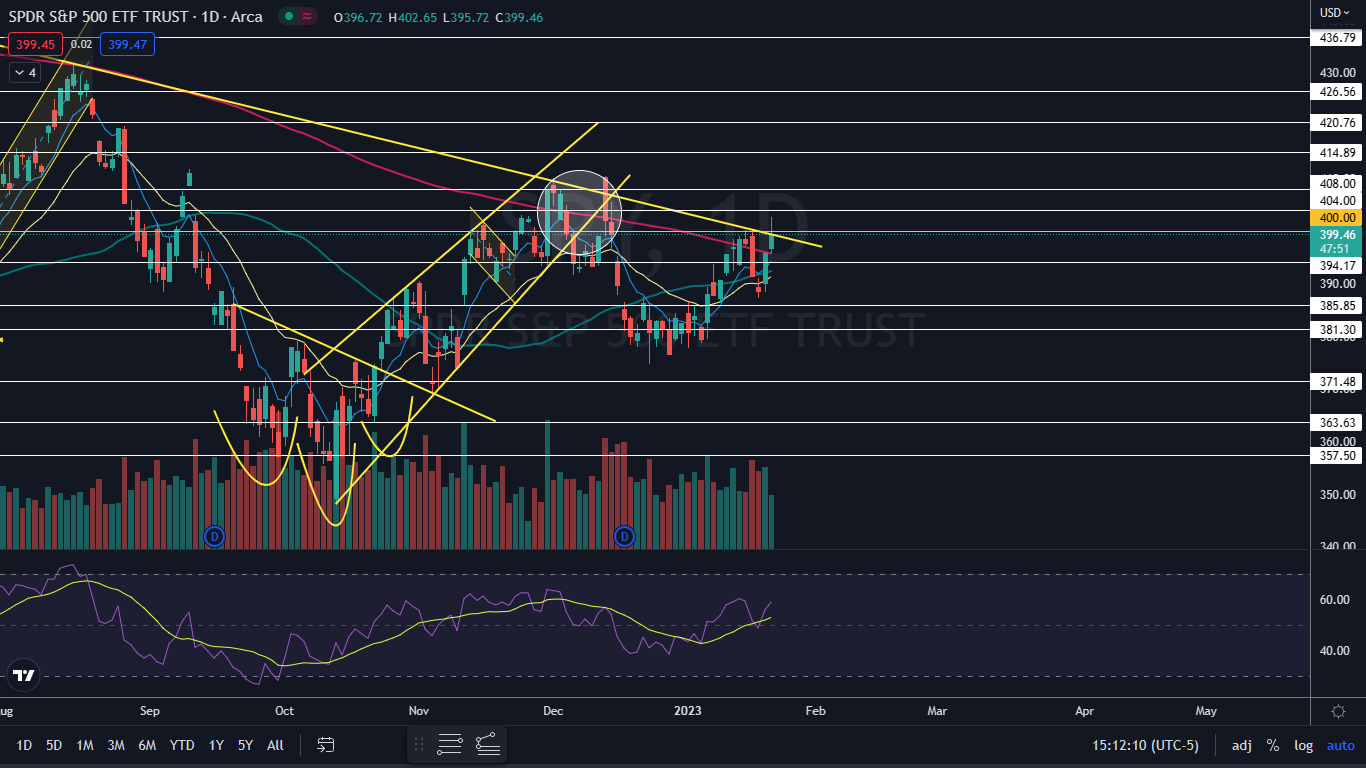
The SPDR S&P 500 SPY gapped up above the 200-day simple moving average on Monday when the market opened. Big big volume came in and drove the market ETF above a long-term descending trendline.
The trendline has been a highly watched indicator by traders and investors since the SPY began trading under the area on Jan. 5, 2022. The break up above the trendline provided hope to bullish traders who are looking for signs the bear market could be coming to an end, although the SPY will need to reach about $418, up 20% from the Oct. 13 low of $348.11, before a new bull market can be called.
On Monday afternoon at 1:40 p.m., the SPY reached a $402.64 high-of-day and began to sell off, which dropped the ETF back down slighly below the important descending trendline, where a fierce battle between the bulls and the bears started to take place.
It’s likely the market direction may not be confirmed for a few more days, especially with Microsoft and Tesla set to print earnings reports on Tuesday and Wednesday, respectively.
As the SPY retraces to test the descending trendline as support, a close under the area could suggest that Monday’s bullish move north was another bull trap.
Want direct analysis? Find me in the BZ Pro lounge! Click here for a free trial.
The SPY Chart: The descending trendline is trending at the $400 mark, which is also an important psychological support and resistance level. If the SPY closes under that level, lower prices could come on Tuesday but if the SPY is able to close the trading day above the area, higher prices or sideways trading could be in the cards.
- If the SPY closes under the trendline, it’s likely the ETF will fall to test the 200-day SMA as support. If the SPY is unable to hold above the 200-day SMA, the likelihood that a bull trap occurred increases.
- If the SPY is able to remain trading above the 200-day SMA for a few more days, the 50-day SMA is likely to cross above the 200-day, which would cause a golden cross to form on the chart. This would suggest the price action between Jan. 18 and Jan. 20 was a bear trap.
- The SPY has resistance above at $402.11 and $404 and support below at $394.17 and $390.71.
 Read Next: 5 Key Investor Questions Elon Musk, His Tesla Team May Address On Wednesday's Q4 Earnings Call
Photo via Shutterstock.
Edge Rankings
Price Trend
© 2025 Benzinga.com. Benzinga does not provide investment advice. All rights reserved.
Trade confidently with insights and alerts from analyst ratings, free reports and breaking news that affects the stocks you care about.