Advanced Micro Devices, Inc AMD was popping up about 3.2% Tuesday ahead of its fourth-quarter earnings print set to take place after the market close on Tuesday.
When AMD printed its third-quarter results on Nov. 1, the stock gapped up 5.6% to start the following trading day, but closed the session down 4.64%.
For the third quarter, AMD reported earnings of 67 cents per share on revenues of $5.565 billion. The company missed the EPS estimate of 68 cents on revenues of $5.62 billion.
For the fourth quarter, analysts, on average, estimate AMD will report earnings per share of $0.67 on revenues of $5.5 billion.
On Monday, Susquehanna analyst Christopher Rolland maintained a Positive rating on AMD and raised the price target from $80 to $88. Rolland has an accuracy rate of 72%.
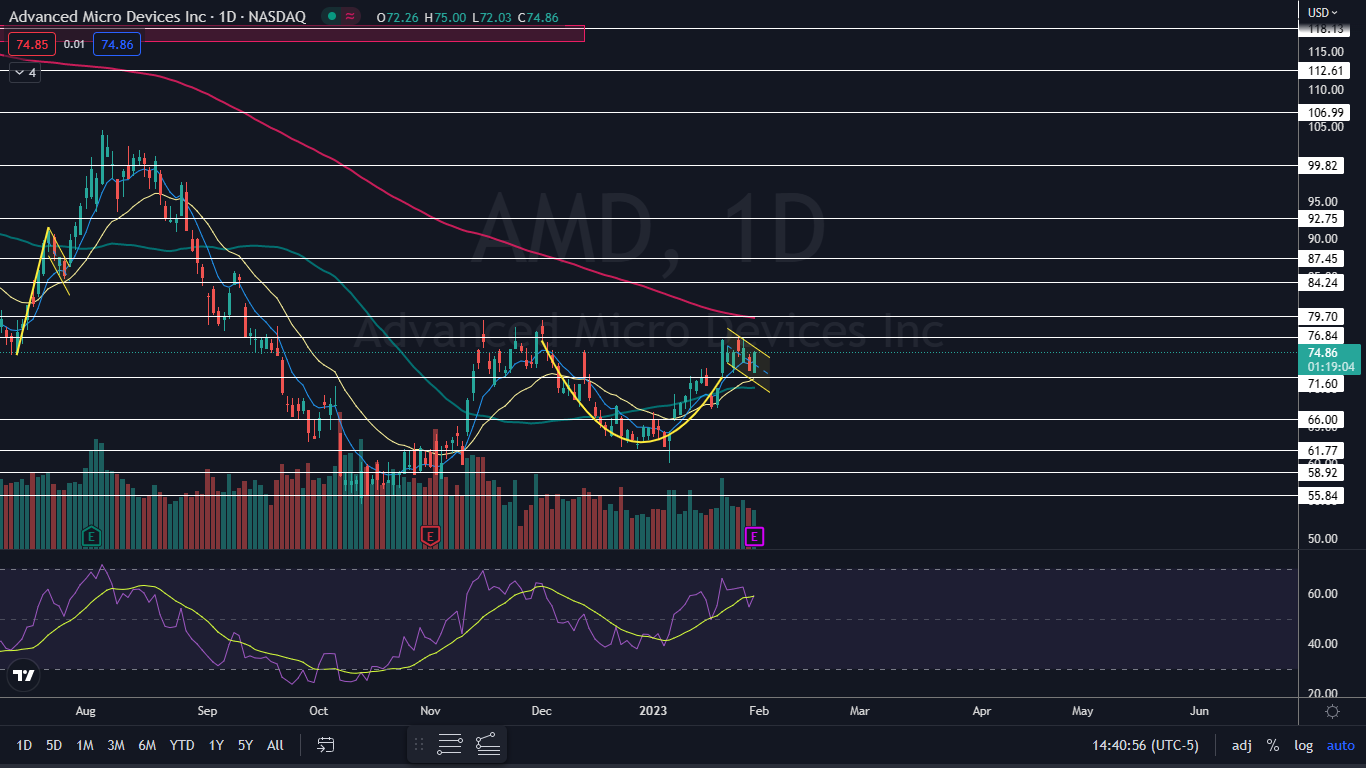
From a technical analysis perspective, AMD’s stock looks bullish heading into the event, having settled into a possible cup-and-handle pattern on the daily chart.
It should be noted that holding stocks or options over an earnings print is akin to gambling because stocks can react bullishly to an earnings miss and bearishly to an earnings beat.
Want direct analysis? Find me in the BZ Pro lounge! Click here for a free trial.
The AMD Chart: AMD settled into a cup-and-handle formation between Dec. 1 and Tuesday, with the cup forming between Dec. 1 and Jan. 23 and the handle forming over the days that have followed. If the pattern is recognized and AMD receives a positive reaction to its earnings print, the measured move is about 23%, which indicates the stock could rise toward $94.
- If AMD breaks up from the cup-and-handle formation, the stock is likely to regain support at the 200-day simple moving average (SMA). When a stock is trading above the 200-day SMA, it gives bullish traders confidence, although the area is usually back-tested as support after being regained.
- If AMD suffers a bearish reaction to its earnings print and falls under the lower descending trendline of the handle formation, the pattern will be invalidated, and a longer-term downtrend could occur.
- AMD has resistance above at $76.84 and $79.70 and support below at $71.60 and $66.

© 2024 Benzinga.com. Benzinga does not provide investment advice. All rights reserved.
Comments
Trade confidently with insights and alerts from analyst ratings, free reports and breaking news that affects the stocks you care about.